Documentation menu
AI impact
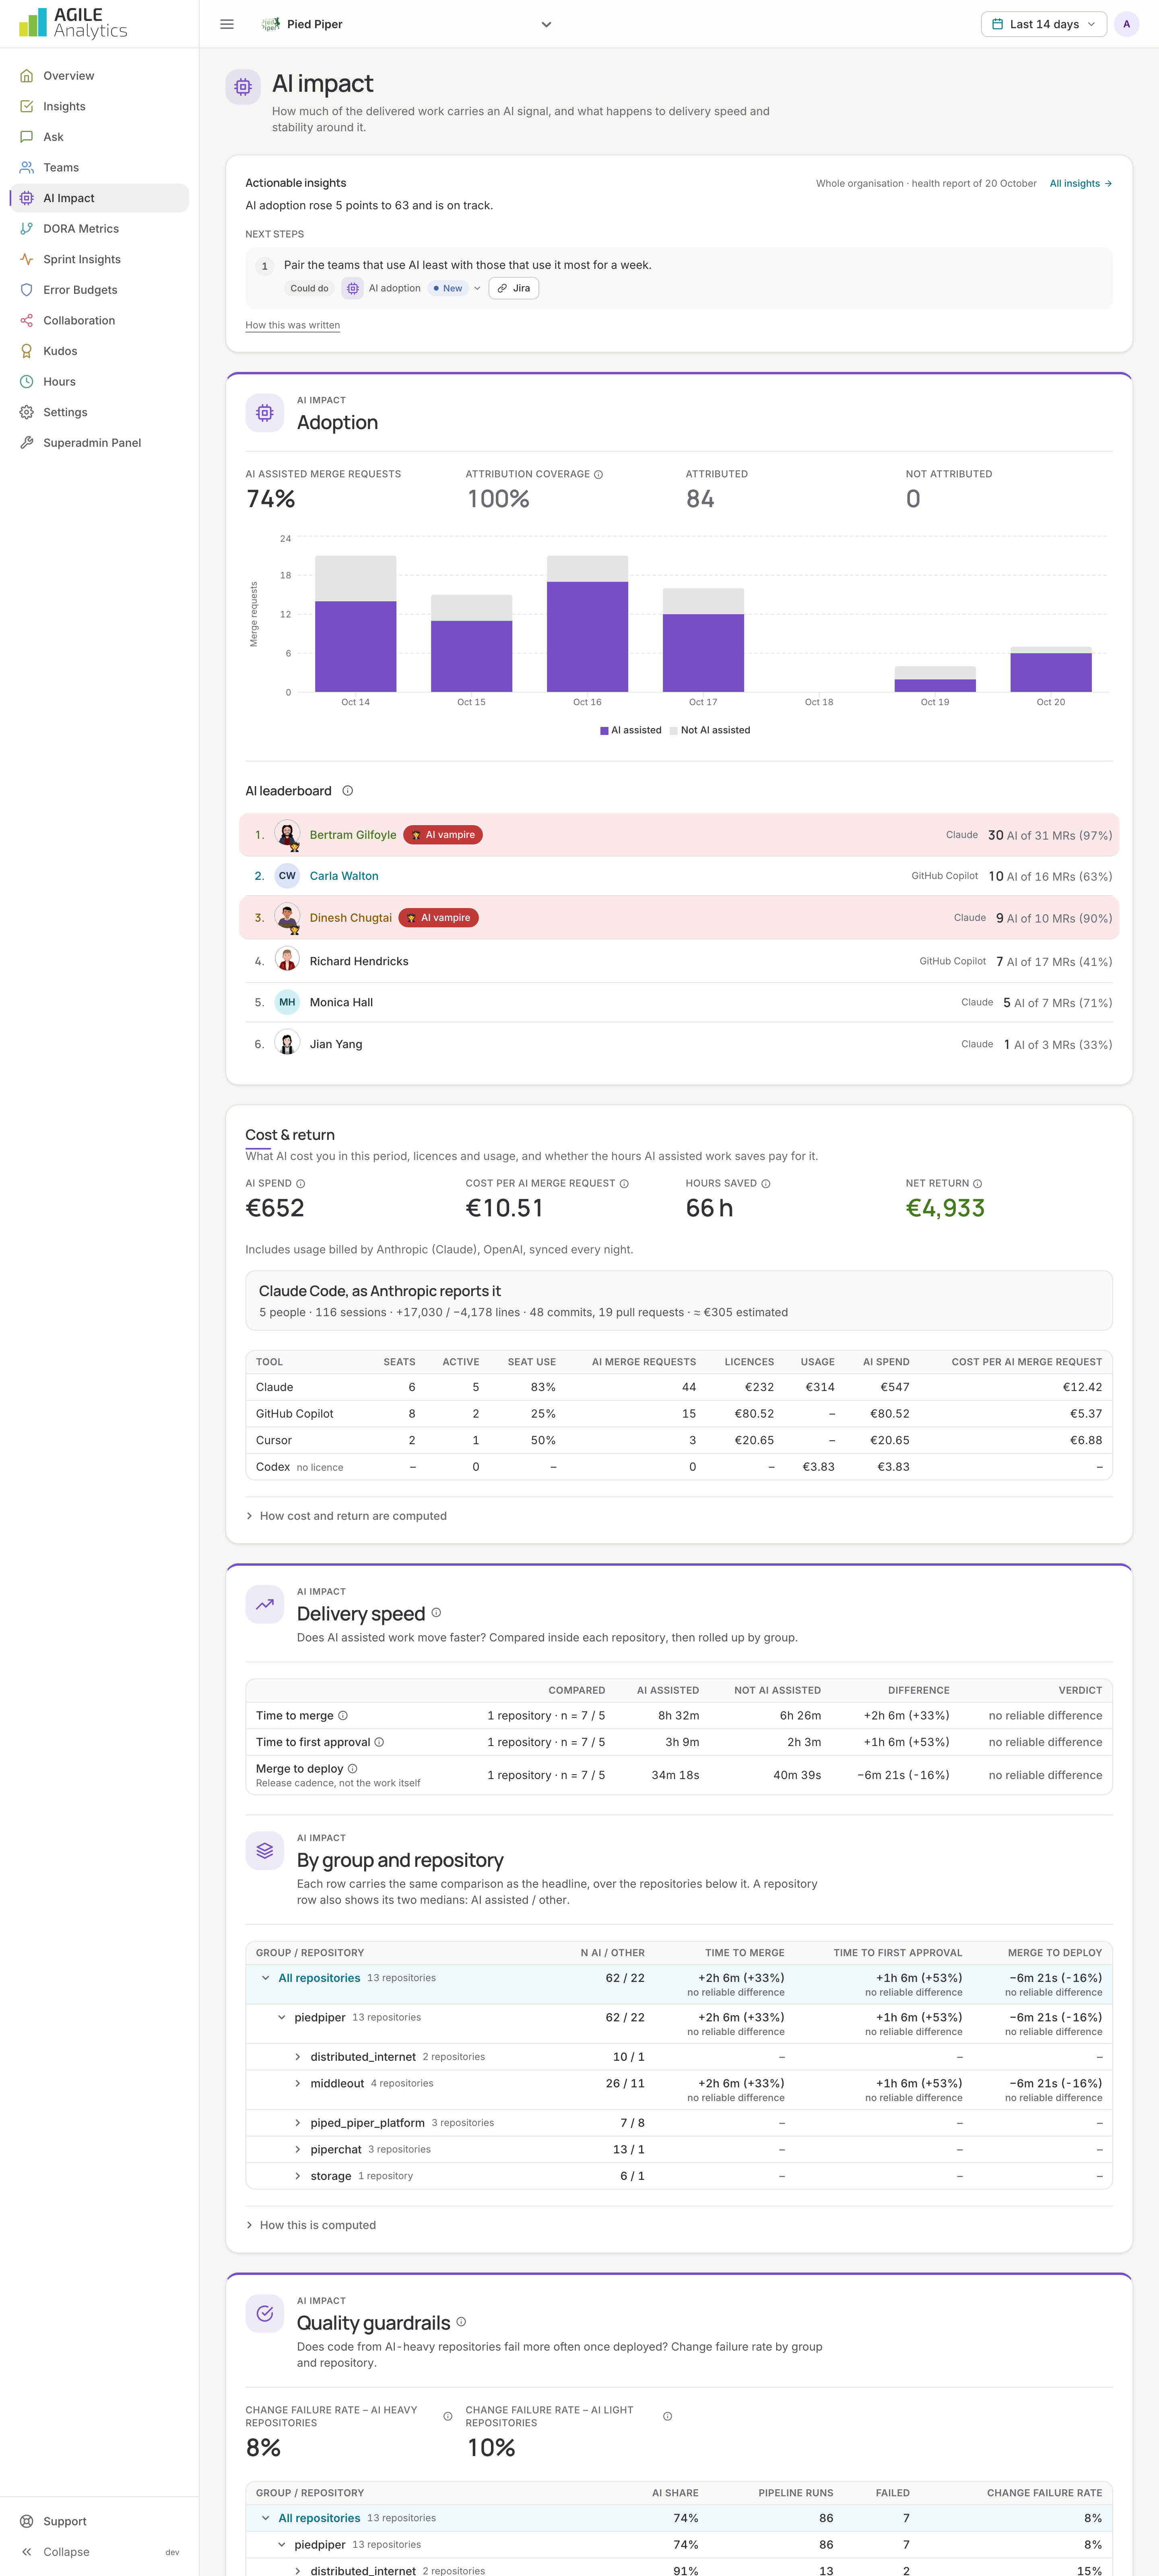
AI impact shows how much of your delivered work carries an AI signal, what happens to delivery speed and stability around it, what AI costs you and what it returns, and who leans on it most.
How AI work is recognised
AI coding assistants such as Claude Code, GitHub Copilot, Cursor, Codex, Gemini, Devin and Aider sign the commits they help write with a Co-authored-by trailer. Agile Analytics reads the commits of every merged merge request from your Git provider and marks the merge request as AI assisted when one of its commits names an assistant; the tool is recorded too. This happens within seconds of a merge, and a nightly job catches anything missed. Commits on any branch are read every hour as well, so people who push without a merge request are counted. Merge requests whose commits could not be read are not attributed and are left out of the shares.
Adoption
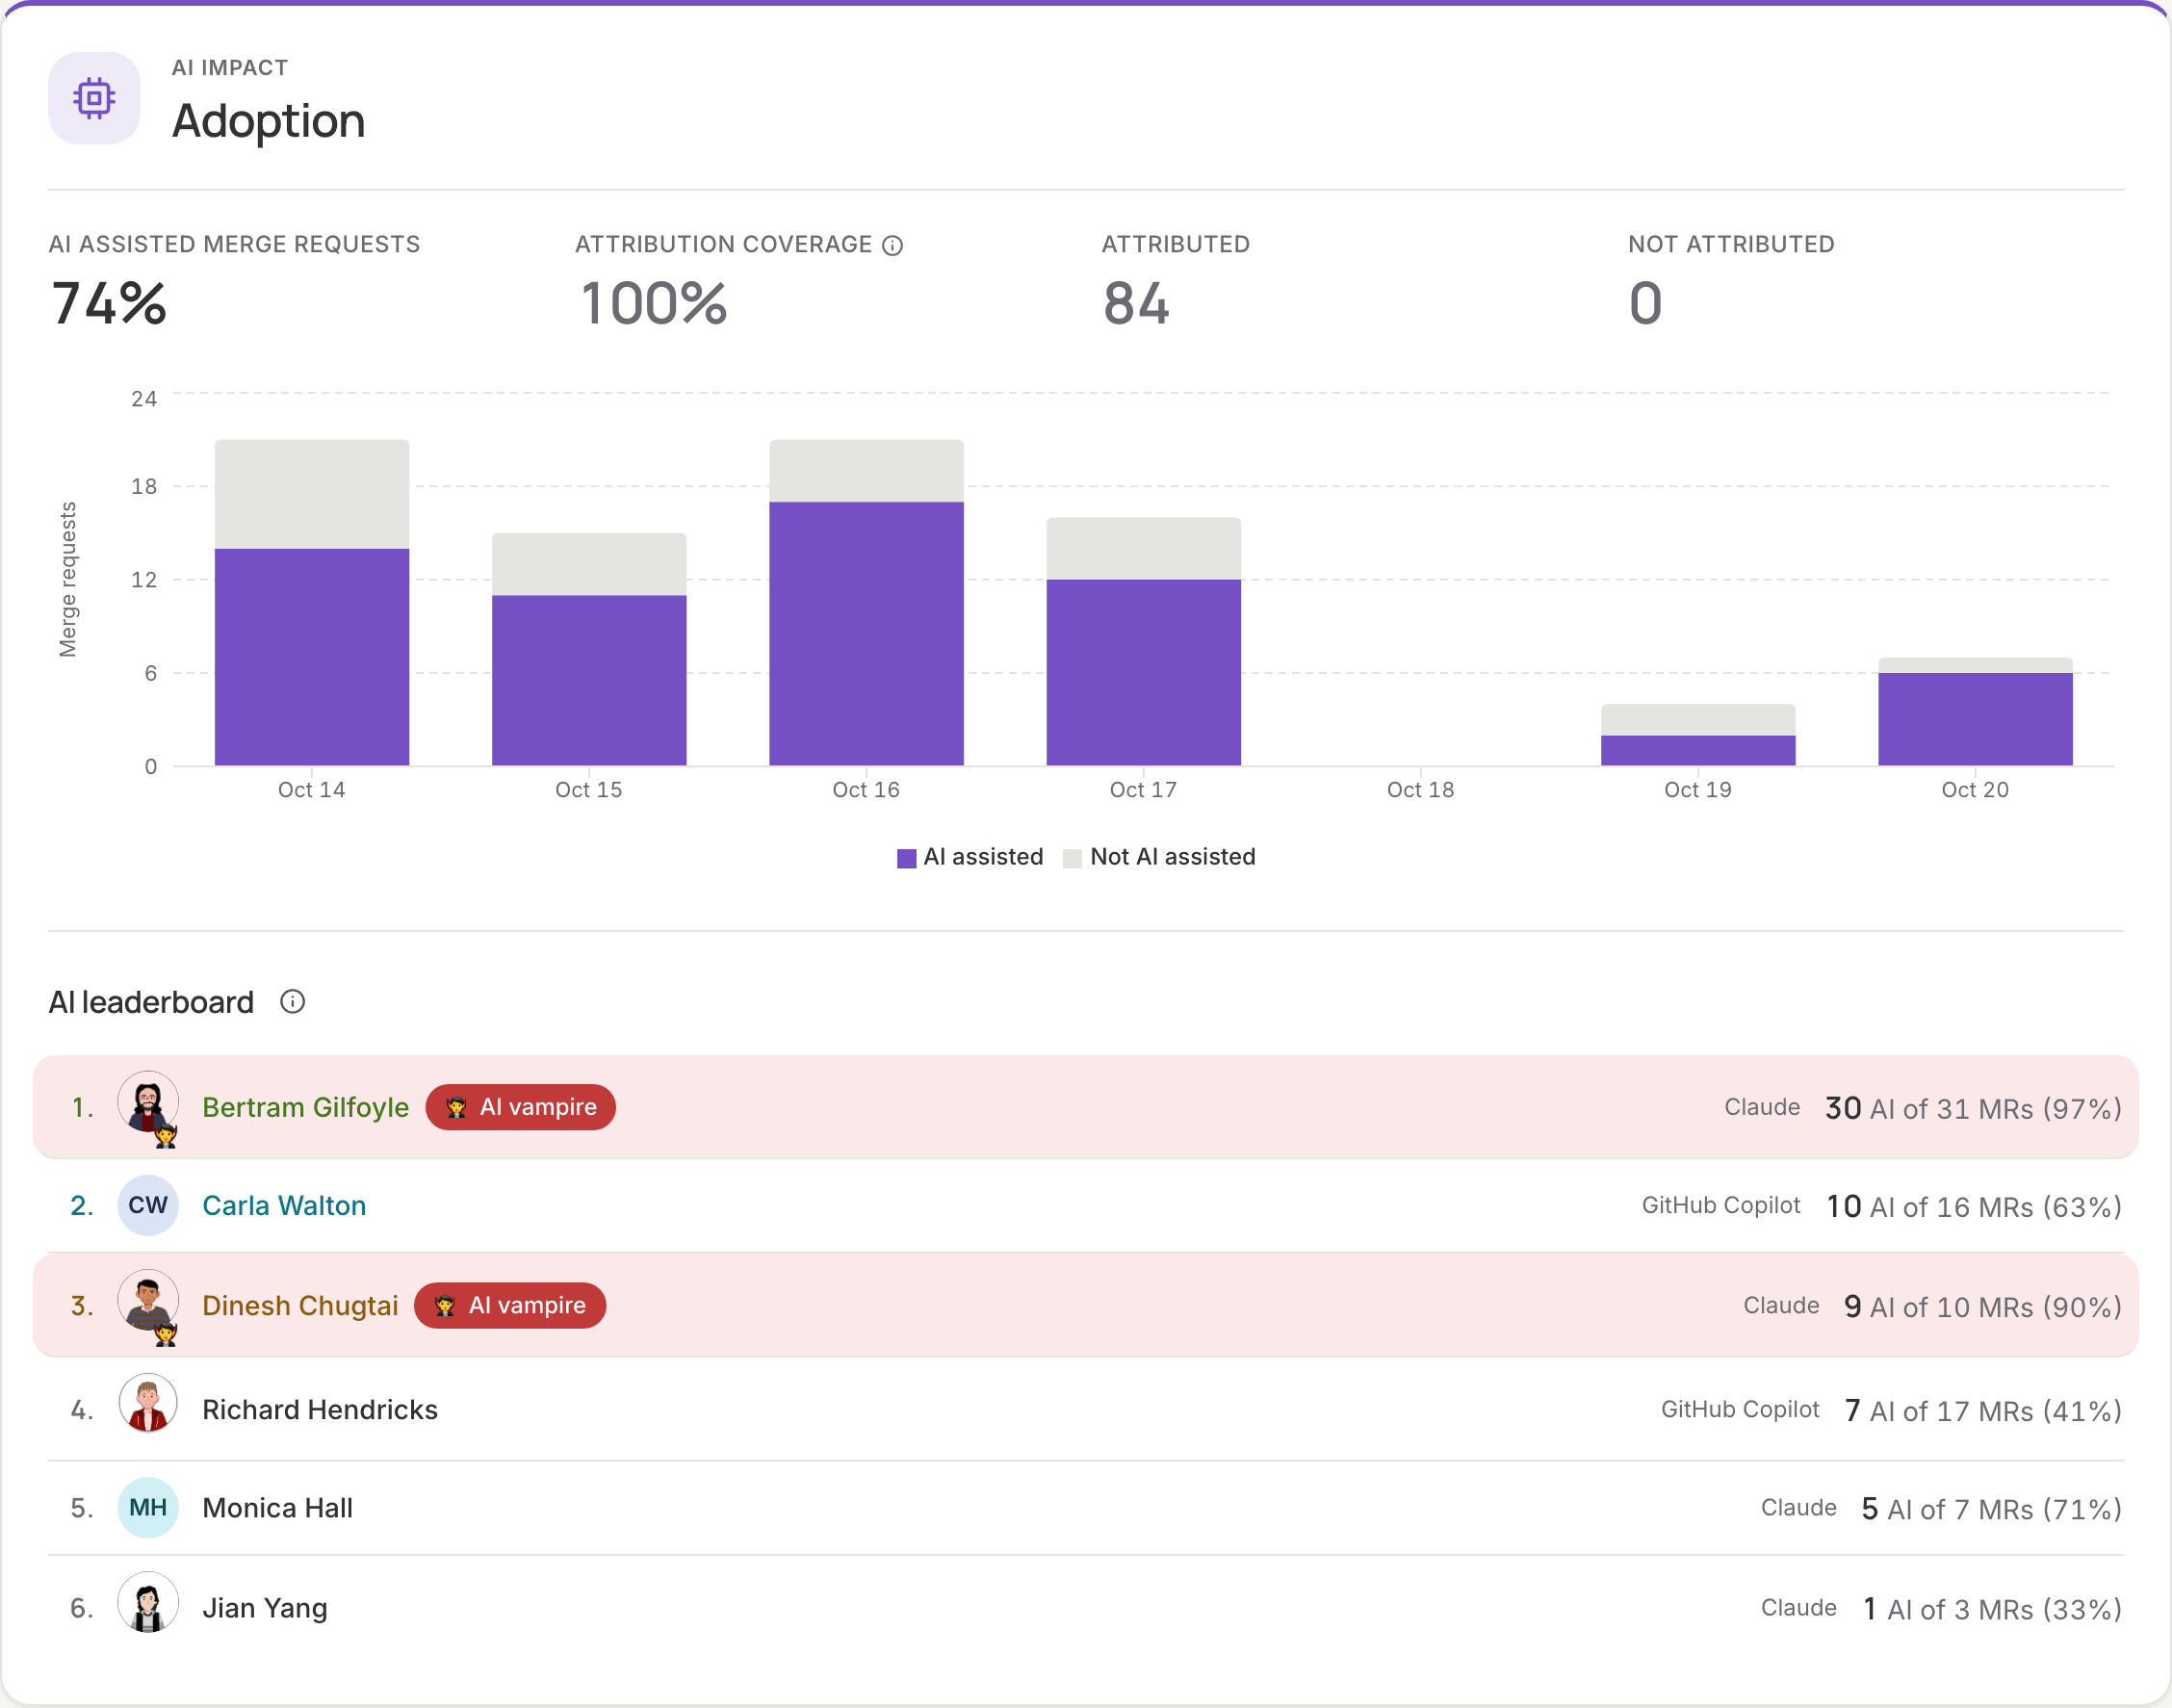
The share of merged merge requests that were AI assisted in the period, next to the attribution coverage: the share of merge requests that could be attributed at all. Read the adoption rate against that number. A bar per day (per week for periods over two months) shows AI assisted, not AI assisted and not attributed merge requests, and a second figure counts AI co-authored commits. The table below splits adoption by group and repository.
Delivery speed
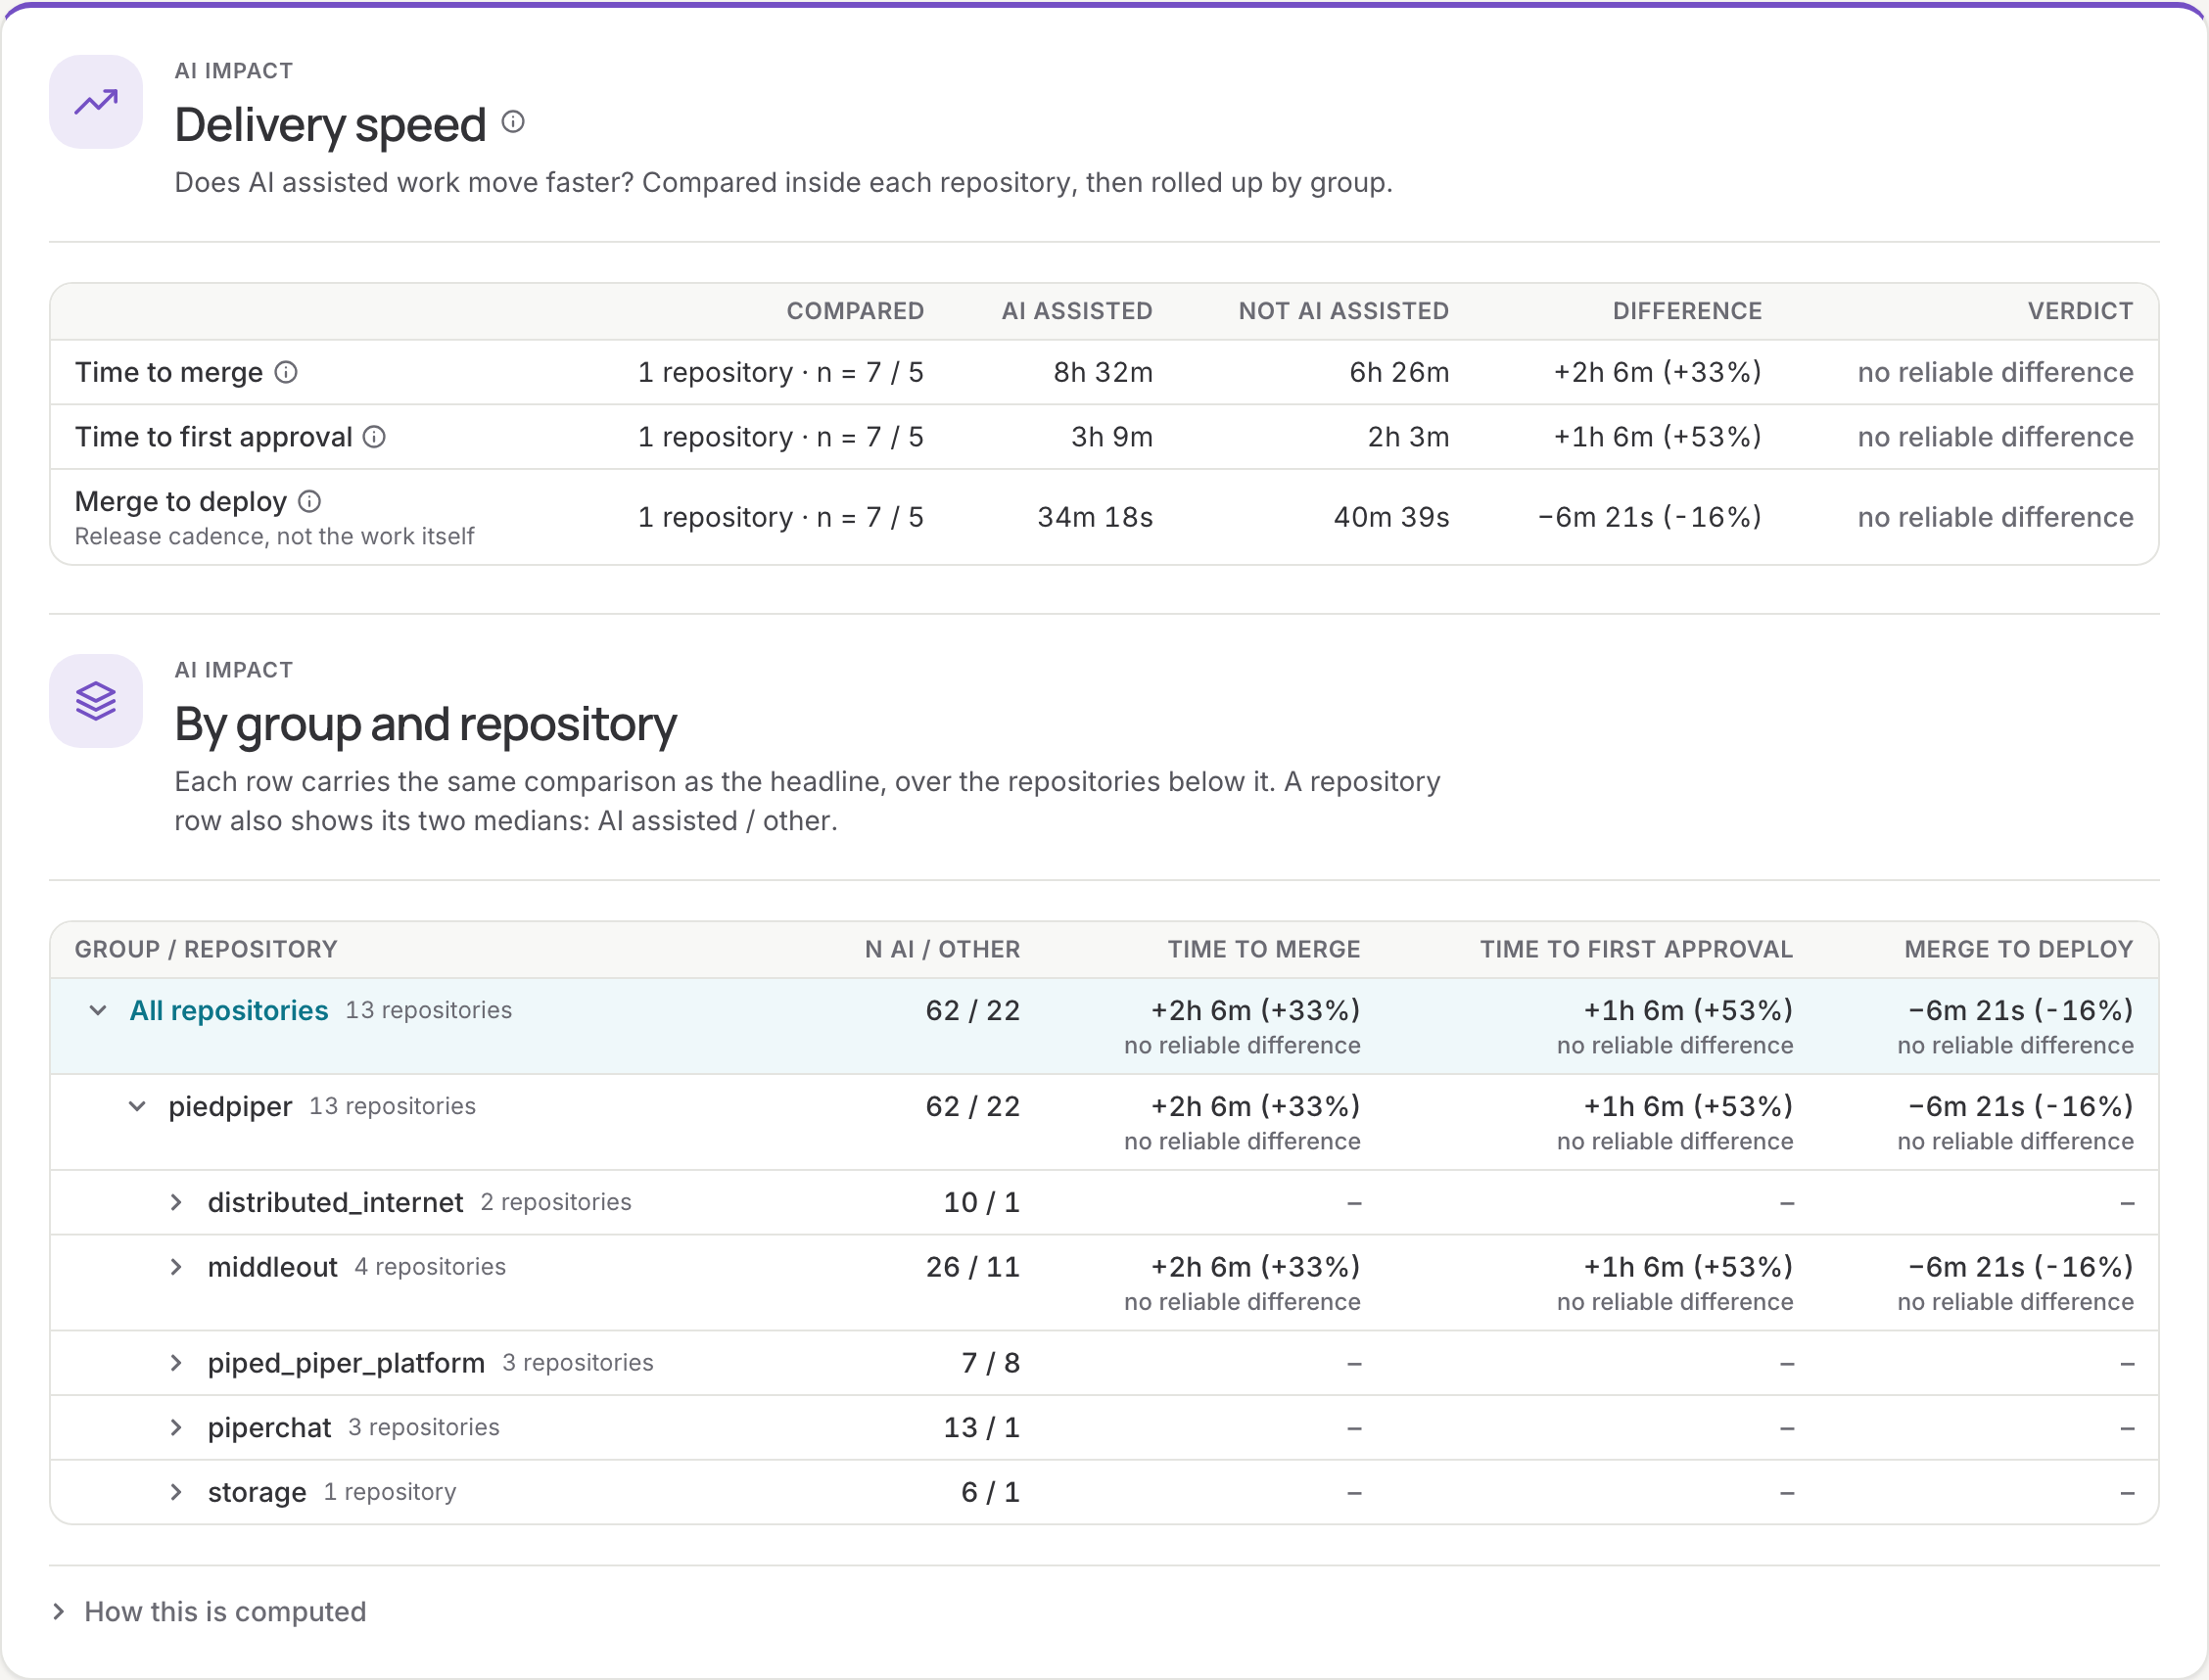
Does AI assisted work move faster? AI assisted and other merge requests are compared inside each repository, never across repositories: a repository that releases weekly makes every merge wait, whatever wrote the code. For each repository with enough merge requests in both groups, the page compares the median time to merge, time to first approval and merge to deploy, then rolls the differences up by group. A verdict (faster with AI, slower with AI, no reliable difference) is only given when the direction survives resampling the data.
Quality guardrails
Does code from AI-heavy repositories fail more often once deployed? Each repository gets the share of its attributed merge requests with an AI signal; above the threshold it counts as AI heavy. The change failure rate of AI heavy and AI light repositories is compared, with the same pipeline feed as the DORA page.
These are cohort comparisons, not a controlled experiment. AI assisted and other changes are not randomly assigned, so a difference here is a lead to investigate, not proof that AI caused it.
DORA over time
Deployment frequency, lead time for changes and change failure rate day by day (week by week for longer periods) for a group or repository, with the number of AI assisted and other merge requests merged over the same weeks. With a single repository selected, the chart also draws both groups' lead times.
Cost & return
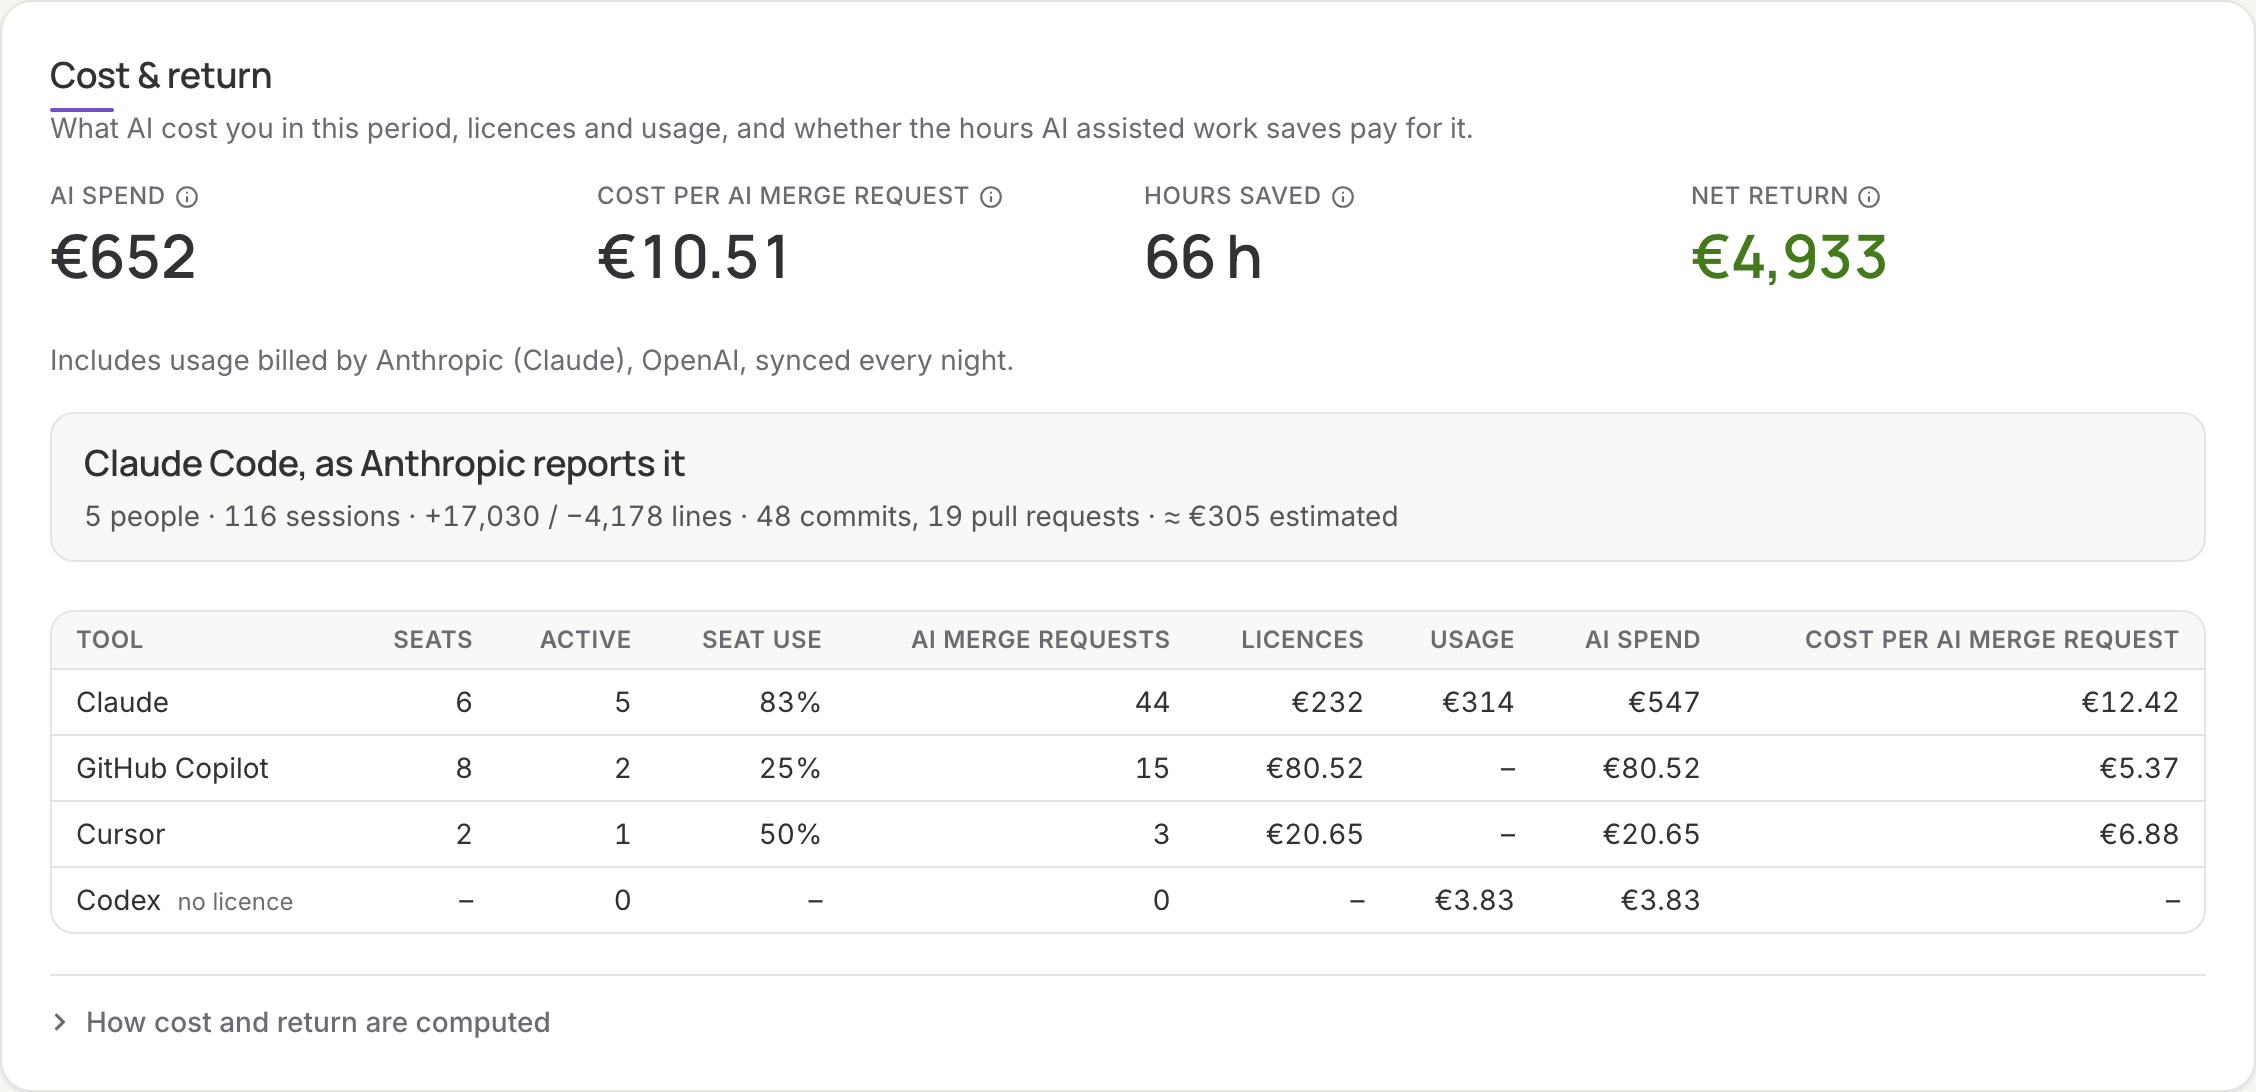
What AI cost you in the period, and whether the hours AI assisted work saves pay for it:
- AI spend: the licences from Settings → AI tools, spread over the days they ran, plus the usage billed by the vendors you connected (see Connect AI vendors), converted at the European Central Bank rate of the day.
- Cost per AI merge request: spend divided by the AI assisted merge requests merged in the period.
- Hours saved: the return is measured, not assumed. For everyone whose merge requests can be linked to their booked hours, each month with enough merged merge requests gives hours per merge request; months with a high AI share are compared with months with a low one. The difference, times the AI assisted merge requests in the period, is the hours saved. It is only valued when enough people take part and the direction survives resampling.
- Net return: hours saved times the cost of an engineering hour, minus the spend.
A table per tool shows seats, people who merged AI work with it, seat use and AI merge requests. Anthropic also reports Claude Code use per person: sessions, lines added and removed, commits and pull requests, with an estimated cost. How cost and return are computed on the page spells out the method with your own numbers.
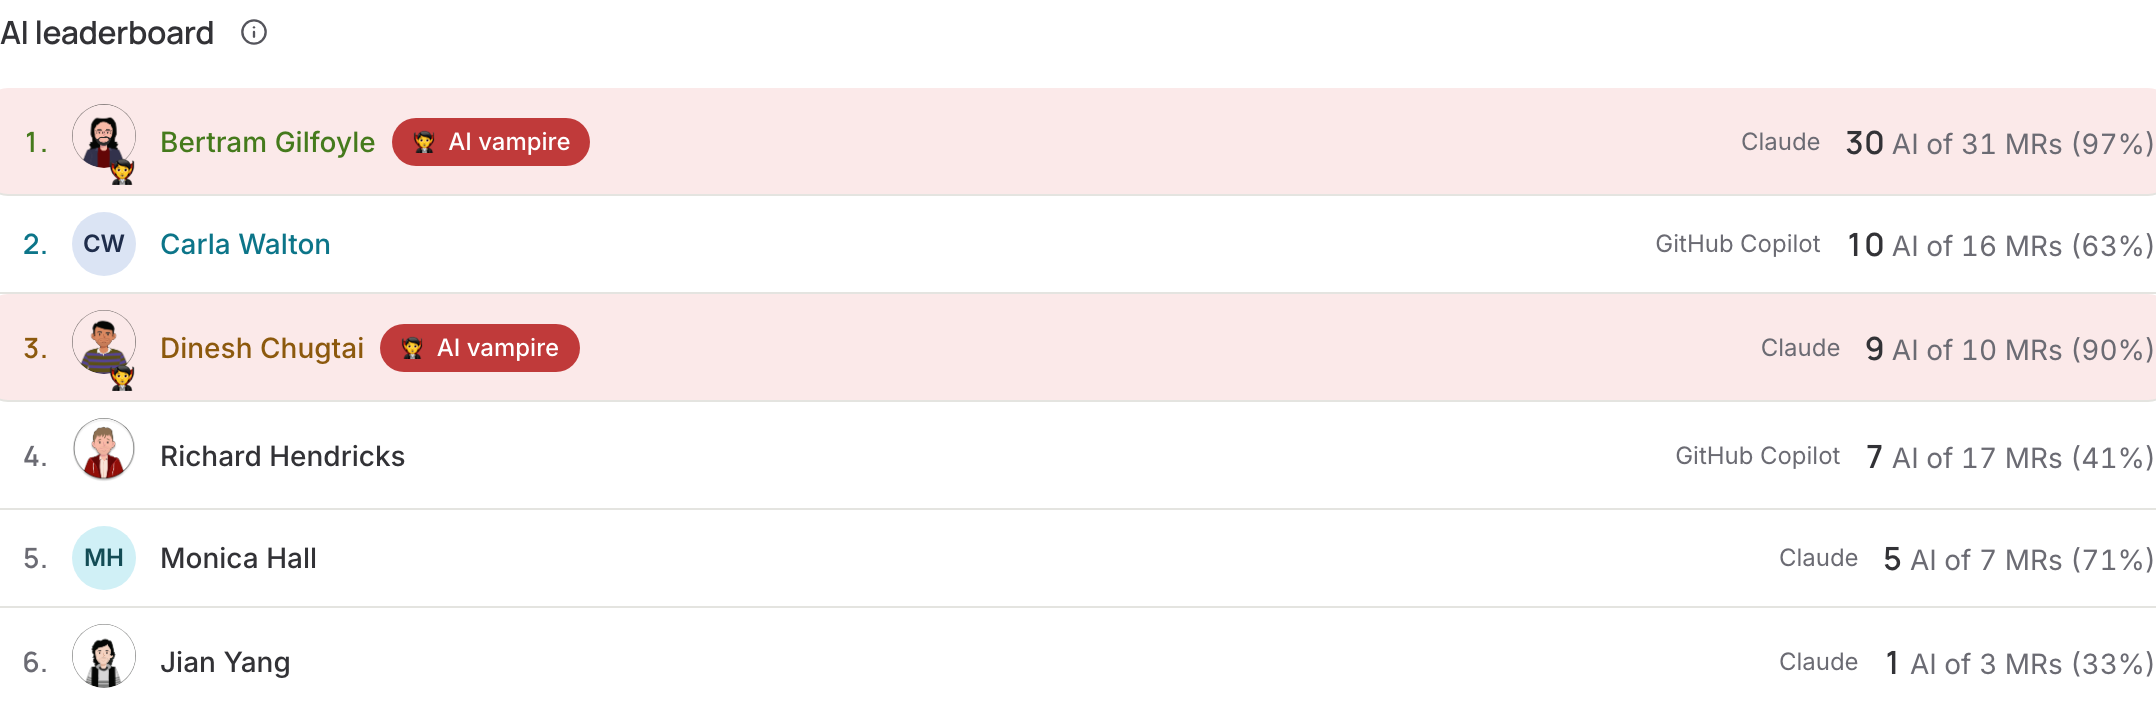
AI leaderboard
Everyone who merged something in the period, ranked by their AI assisted merge requests, with the share of their work that carried an AI signal and their AI co-authored commits. Click a name to see those merge requests, each linked to its Git provider. An AI vampire works with AI on nearly everything, at more than a handful of AI assisted merges a week: impressive, but a signal to get some sleep. Admins can switch the leaderboard off under Settings → AI tools.
Where AI impact is used
- AI adoption, one of the eight health areas, with full marks at 50% AI assisted merge requests.
- The AI adoption tile on the overview, the weekly e-mail and the assistant.
AI impact is part of the Scale-Up and Enterprise plans; the leaderboard and vendor spend are Enterprise. See Plans.