New · the Backstage plugin

Agile Analytics, right inside Backstage.

Engineering health and AI adoption in the developer portal your teams already open every day.

From €12 per collaborator a month · no seat minimum

Or book a demo on your own data →

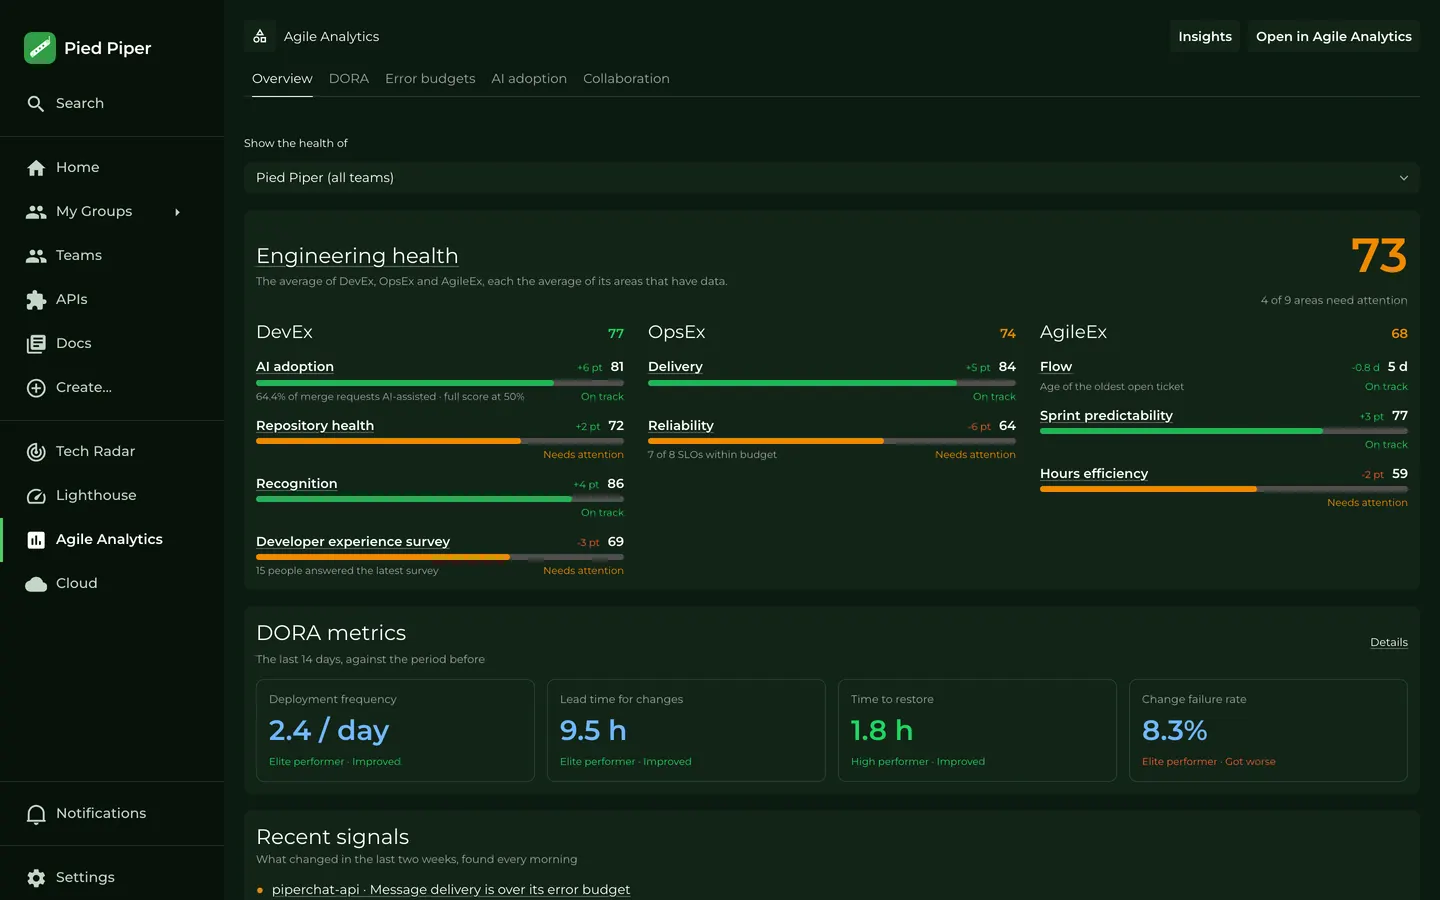
The Agile Analytics page in Backstage for the whole Pied Piper organisation: an engineering health score of 73 built from DevEx, OpsEx and AgileEx, the four DORA metrics, and a list of recent signals.
Screenshots with sample data.

The problem

The numbers exist. Just not where anyone looks.

Spread over tools

Delivery in one dashboard, SLOs in another, AI usage in a vendor console. Nobody puts them side by side.

No view per team

Managers see an average for the whole organisation, not which team needs help this week.

AI bought on faith

Copilot, Cursor and Claude Code licences get renewed without anyone knowing what they return.

Engineering health

One score for the organisation, and for every team.

DevEx, OpsEx and AgileEx in one number, on the Backstage page your people already use.

  • Nine areas, from AI adoption and repository health to reliability and sprint predictability, each with its trend and On track or Needs attention.
  • The whole organisation or one team, over 7, 14, 30 or 90 days.
  • Recent signals every morning: an SLO over budget, a DORA metric up a level, a repository that rests on one person.
  • Each signal points at the service, repository or team, one click from the detail in Agile Analytics.
The Overview tab for the Compression team: an engineering health score of 79, with DevEx 83, OpsEx 80 and AgileEx 74, and a score, trend and status for each area.
Screenshots with sample data.

DORA metrics

DORA, without the spreadsheet.

The four DORA metrics and their benchmark level, worked out from your own deployments.

  • Deployment frequency, lead time for changes, time to restore and change failure rate, each rated Elite, High, Medium or Low.
  • Deployments per day, with the ones that needed a fix.
  • Deploys, failure rate and lead time per repository.
  • Deployments that needed a fix, found from hotfixes, reverts and SLO alerts, with the time it took to restore.
The DORA tab: 3 deployments a day, a lead time of 11.7 hours, 1.6 hours to restore and a 7.1% change failure rate, a bar chart of deployments per day, a table per repository and the deployments that needed a fix.
Screenshots with sample data.

Error budgets

Error budgets, per service.

Every SLO with what is left of its error budget, lowest first, so the service over budget is the first thing you see.

  • The budget over the period, and per week.
  • Narrowed down to one team when you want.
  • An error budget card on each service’s own page in the catalog, where its team works.
The Error budgets tab: 7 of 8 SLOs within budget. Message delivery of piperchat-api is 18.2% over budget; the other SLOs have between 28.7% and 95.2% left, each with its weekly history.
The PiperChat API service page in the Backstage catalog with the Agile Analytics error budget card: Message delivery is 18.2% over budget, Availability has 28.7% left.
Screenshots with sample data.

AI adoption

AI adoption you can account for.

Not only how much work AI helps with, but whether it ships faster, keeps its quality and pays for itself.

From “we bought licences”
to “this is what they return, and quality holds”.

01

Adoption

The share of merged work AI helped with, AI-assisted merges, coverage and commit adoption, against your own target. Per repository, so you see where AI is used and where it isn’t.

AI adoption at 64.4% against a 50% target, 47 of 77 merges AI-assisted, 94.8% coverage and 64% commit adoption, a table of adoption per repository, and merges and commits per tool for Claude Code, Copilot and Cursor.

02

Tools and work

Merges and commits per tool, such as Claude Code, Copilot and Cursor, and the recent work each one helped with.

Merges and commits per AI tool and a list of recent AI-assisted work, each item with its repository, author, tool and date.

03

Speed and quality

Time to first approval, to merge and to deploy, with and without AI in the same repositories. Change failure rate and rework where most work is AI-assisted, against the rest.

Speed and quality as paired bars: time to first approval, to merge and to deploy with and without AI, and the change failure rate and rework of repositories with high and low AI use.

04

Cost and return

What AI tools cost, the cost per AI-assisted merge, the hours saved and the net return.

Cost and return: US$1,409 AI spend, US$31 per AI-assisted merge, 120 hours saved and a net return of US$12,991.

Screenshots with sample data. The figures show what the page measures, not a result we promise.

Collaboration

Who reviews, and who owns what.

Code review and ownership per team and repository, before knowledge quietly ends up with one person.

  • Merged, merged without approval, wait for the first approval and open to merged, per repository.
  • People active, and repositories that are orphaned, at risk, dormant or healthy.
  • Repositories that need an owner, with their bus factor and who knows the code.
  • Coverage and focus per team.
The Collaboration tab: 135 merges, 5.2% without approval, 1.9 hours to the first approval and 9.6 hours from open to merged; 17 of 19 people active; 1 orphaned, 4 at risk, 2 dormant and 16 healthy repositories; the repositories that need an owner; and coverage and focus per team.
Screenshots with sample data.

Part of your portal

A plugin, not one more tool.

Agile Analytics sits next to everything else in Backstage: the catalog, service pages, TechDocs, the Cloud overview and Lighthouse.

Screenshots with sample data.

Themes

Light and dark.

It follows whichever Backstage theme each person picked.
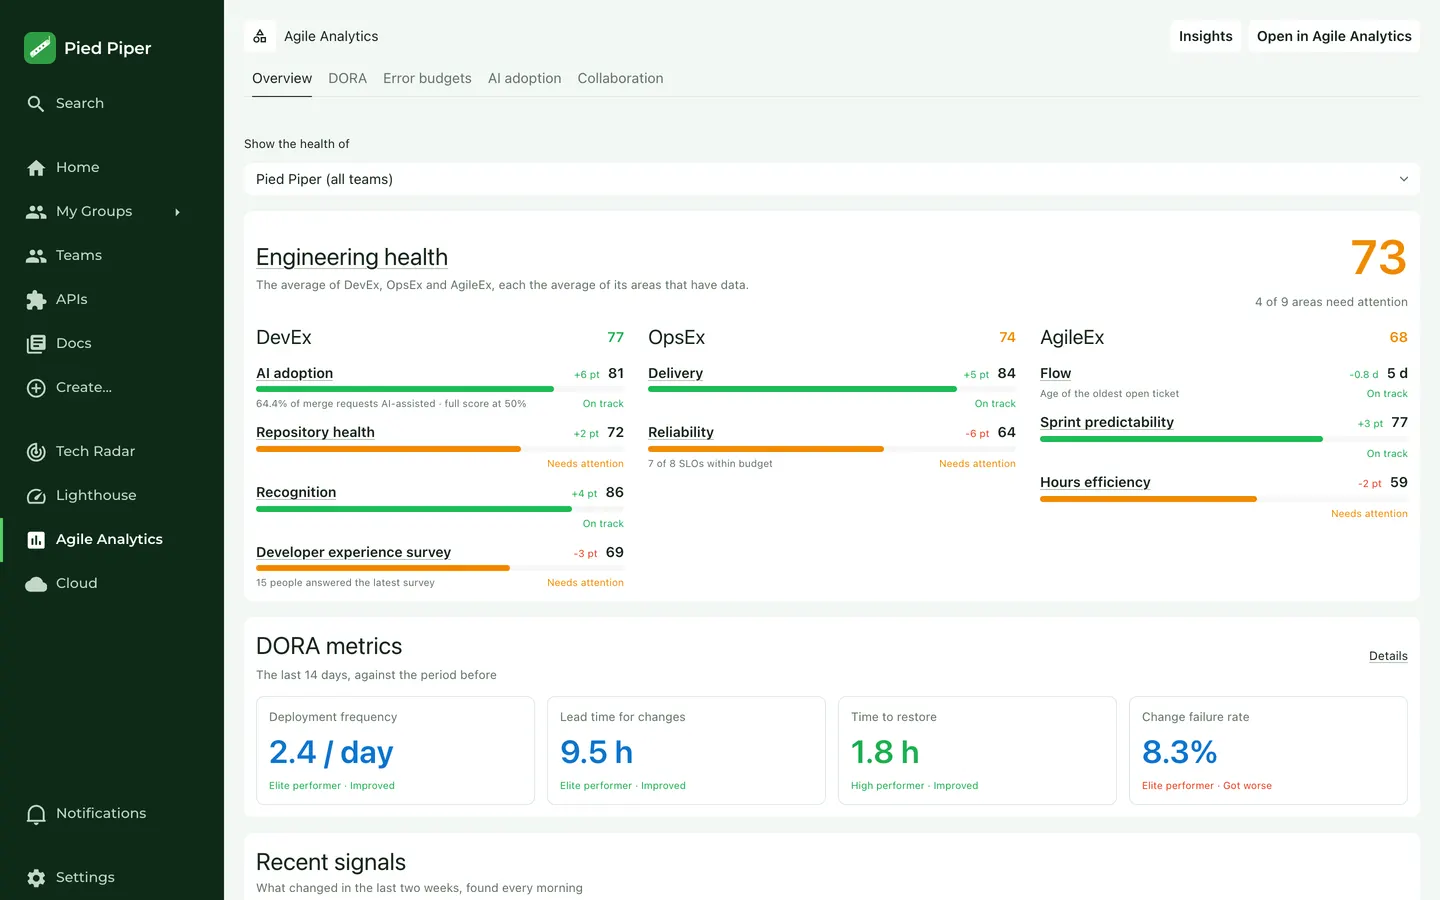
The Agile Analytics overview in the light Backstage theme.
Light
The same overview in the dark Backstage theme.
Dark

How it works

Set up in three steps.

  1. Connect your repositories and tools to Agile Analytics. What you can connect

  2. Install the Backstage plugin and add your API key to the config.

  3. Link services to their SLOs with one annotation in catalog-info.yaml.

    metadata:
      annotations:
        agileanalytics.cloud/service: api

The plugin is in every plan, from Start-up, and in the 60-day trial. Error budgets, AI adoption and collaboration come with Scale-Up, in Backstage as in the app. See pricing

Your engineering metrics, where your teams already are.

Health, DORA, error budgets and AI adoption in Backstage, one click from the detail in Agile Analytics.

Questions about the plugin? Mail sales@agileanalytics.cloud or use the contact form.