
The question the board asks in 2026
You approved the copilot seats. Output went up — Faros AI measured 98% more pull requests merged in teams with high AI adoption — and review time went up 91% with it. DORA's 2025 report ties higher AI adoption to higher delivery instability, and 30% of developers say they have little or no trust in AI-generated code.
The question is no longer whether to use AI. It is whether your delivery loop can absorb it, and where it leaks. That is a measurement question, and the data already sits in your tools.
Flow: where AI output waits
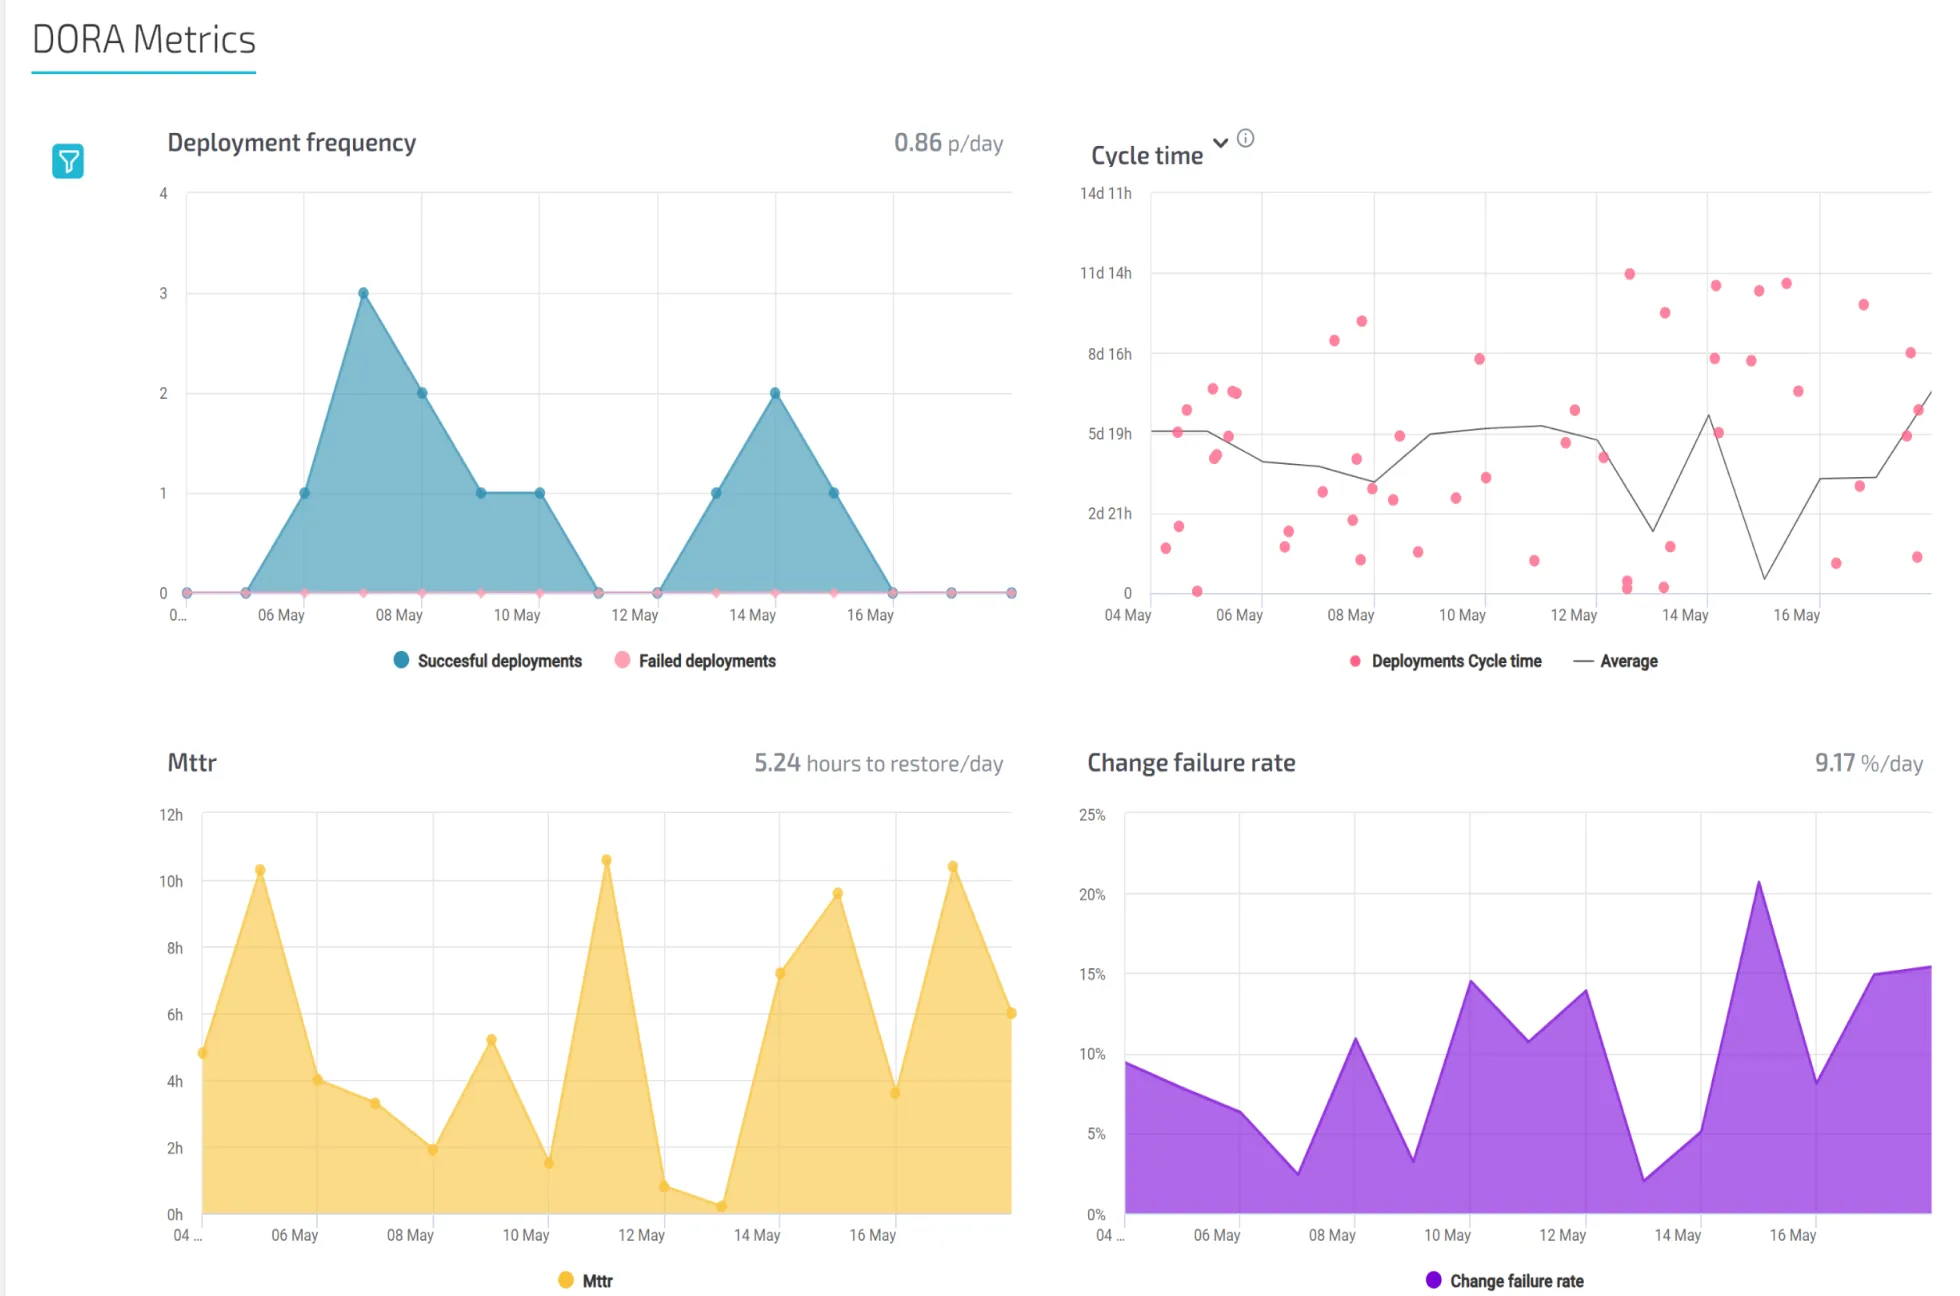
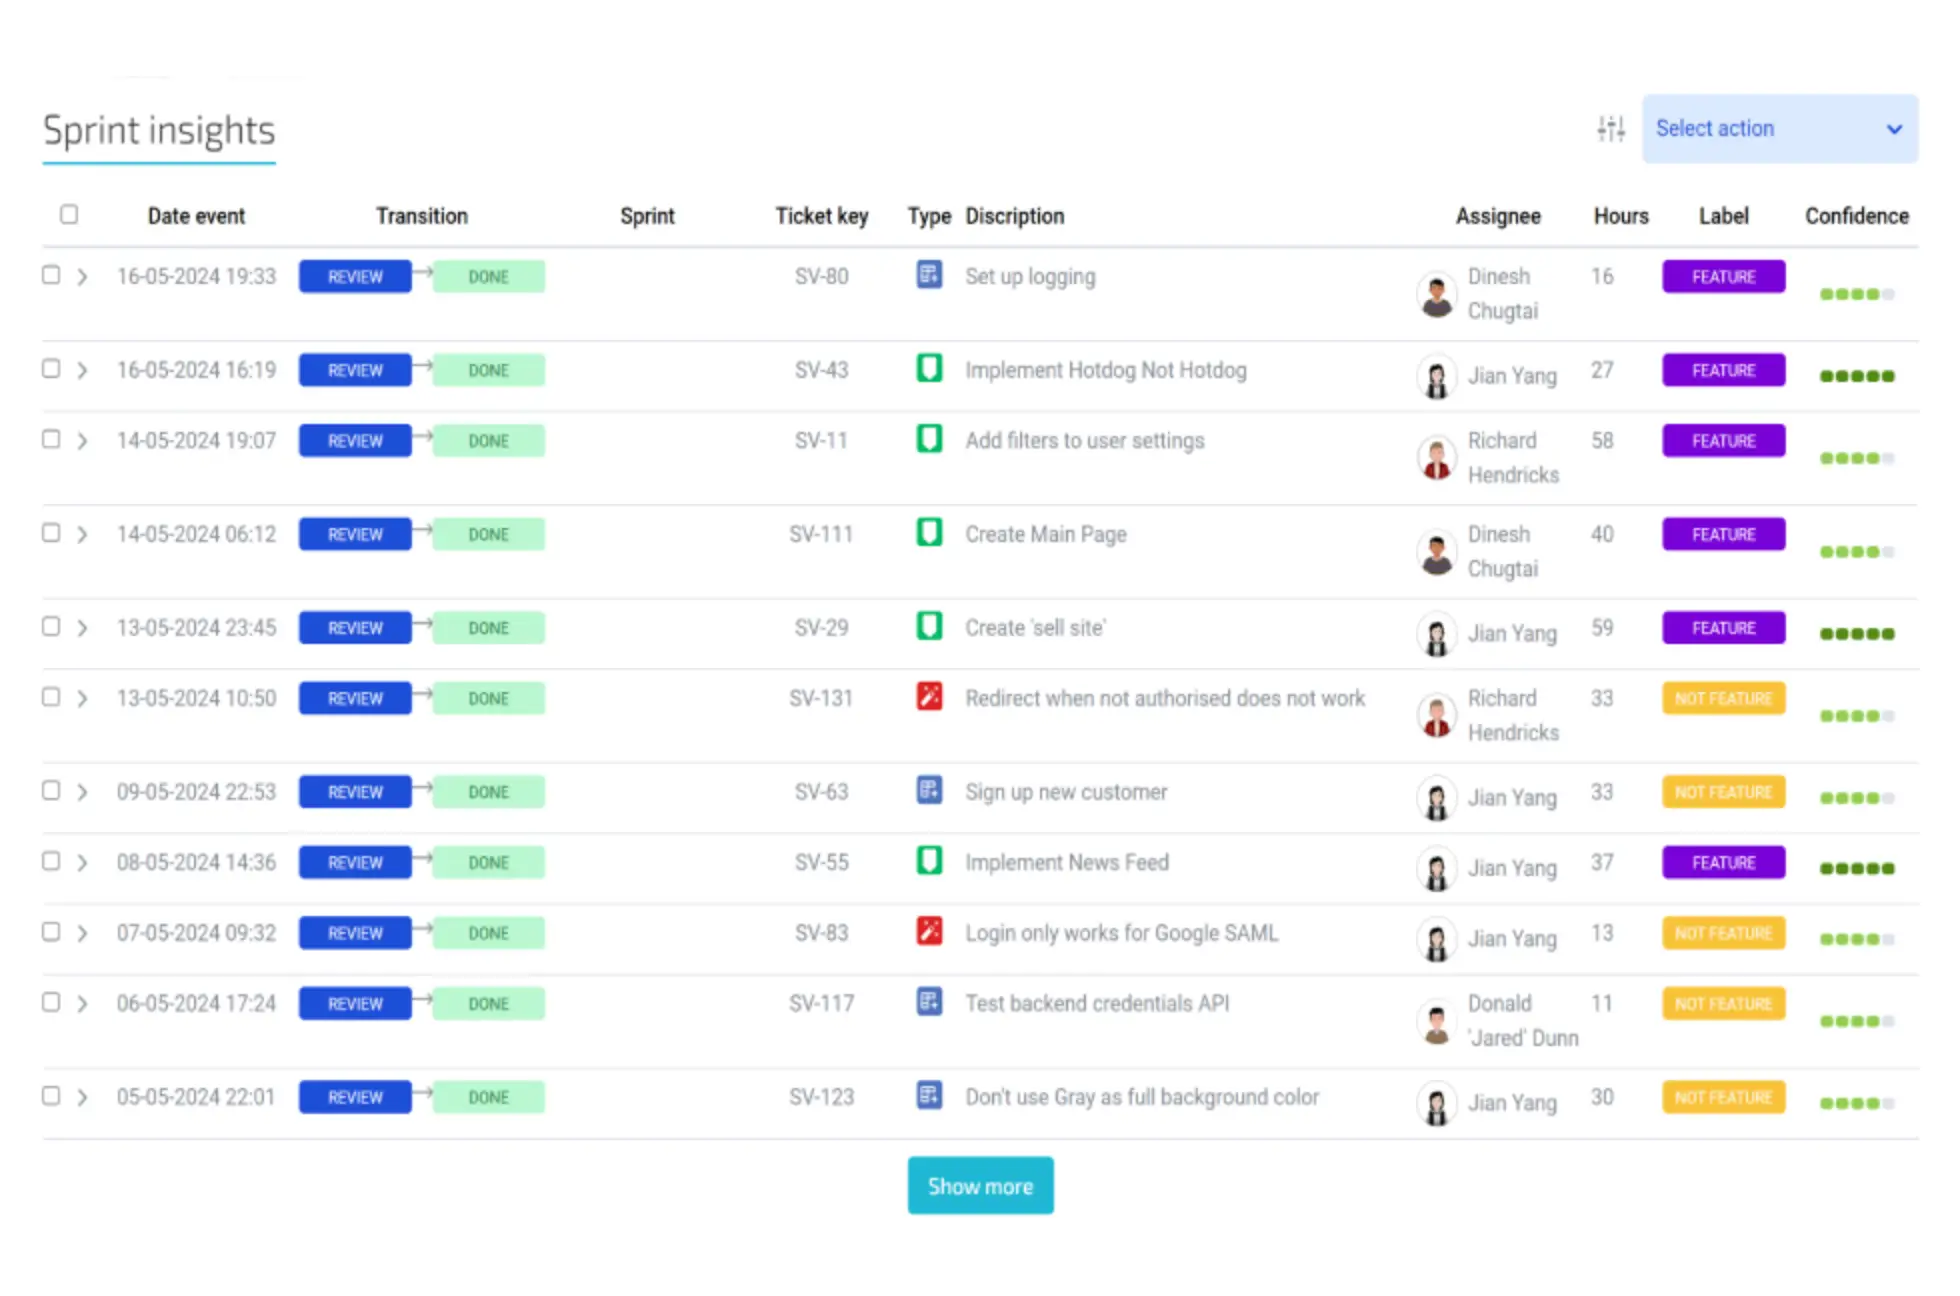
Lead time for changes, deployment frequency and Sprint Insights, per team. Where the queue forms — review, CI, handovers — and whether it moves as teams adopt AI. The sprint report lands every sprint without anyone compiling it.
Quality gates: does it hold?
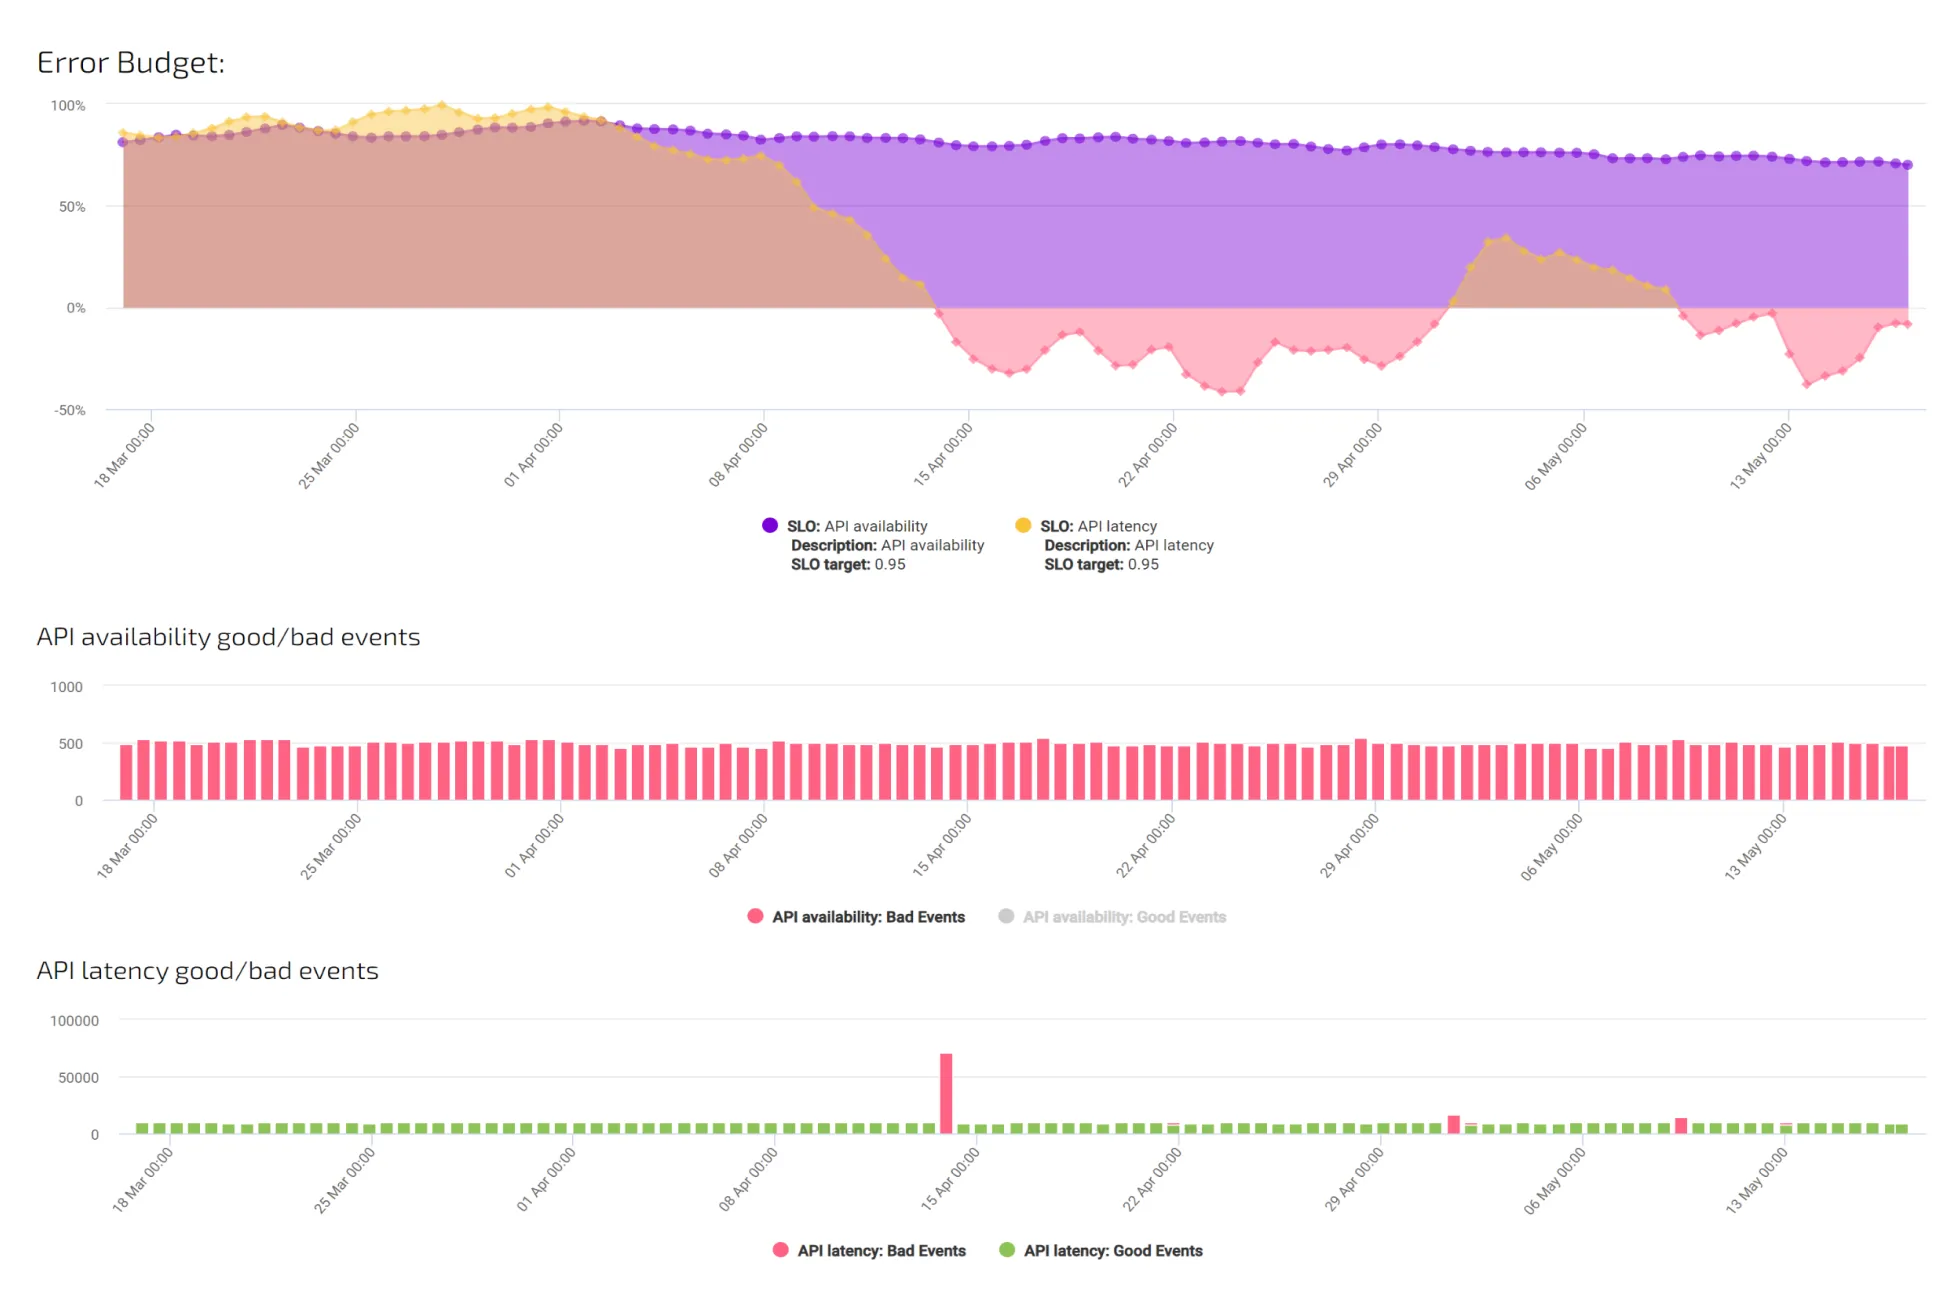
Change failure rate, MTTR and Error Budgets against your SLOs. If code that ships faster also fails more often, this is where it shows first — before a customer notices, and before the board hears about it from someone else.
People: measure the system, not the person
Sprint Insights separates feature work from maintenance; Kudos, developer surveys and interruption data show what the pace does to the team. DORA 2025 found AI leaves burnout and friction unchanged by itself. Measuring the system rather than the individual keeps the conversation about the work, and keeps your engineers on your side.
How it lands in your organisation
No new process, no self-reporting. Three steps.
Connect
Access tokens you create and can revoke, for GitHub, GitLab or Bitbucket, Jira, your CI and your monitoring. Slack for Kudos if you want it. Set-up is measured in an hour, not a quarter.
Baseline
The first sprint gives every team its starting point: lead time, deployment frequency, change failure rate, MTTR, the feature-to-maintenance ratio.
Compare
Teams that lean on AI against teams that don't. This sprint against last. Every gate against its target. The demo shows this on your own data.
Scrum Alliance
We thought our bottleneck was deployment speed. It turned out to be handovers.
Questions engineering leaders ask us
Does this rank individual developers?
No. Every metric is measured on the system — a team, a service, a repository — and reported per team. That is a deliberate choice: individual leaderboards are gamed within a sprint, and DORA's own research measures teams for the same reason.
Which tools does it read?
GitHub, GitLab and Bitbucket for code and pull requests; Jira for tickets and sprints; your CI/CD for builds and deployments; AWS CloudWatch and Google Cloud Monitoring for SLOs and Error Budgets; Slack for Kudos. Grafana and Backstage.io integrations are part of Enterprise++.
Does it measure what the AI tools cost?
Yes. The AI Impact page shows adoption per tool, what the tools cost in licences and metered usage, and the cost and return in euros per AI-assisted merge request. It sits next to lead time, change failure rate and Error Budgets, so spend and outcome are on one page.
Less guessing. More shipped software.
Measure faster — lead time, review wait and deployment frequency per team, every sprint
Guard quality — change failure rate, MTTR and Error Budgets
Prove the gain — feature work versus maintenance, from your own data
See it in 30 minutes — on your own data, not a slide deck