What engineering intelligence actually tells you — and what it can't

Published on 18 October 2024 by Arjan Franzen
If you have been asked to "get some data on delivery", you will quickly find a category of tools that promises exactly that. You will also find it has no settled name. Engineering intelligence, engineering management platform, software engineering intelligence, SEI platform — these are largely the same product category, named differently by whichever vendor is doing the naming.
This is not a review of them. It is an attempt to answer the question underneath the shopping: what does this kind of data actually tell you, and what is it never going to tell you? Both halves matter, and the second half is the one that determines whether the tool ends up being used or quietly abandoned.
What the category actually does
Strip away the positioning and these platforms all do the same three things. They connect to the systems where work already leaves a trace — Git, your ticket tracker, CI, incidents. They reconstruct the path a piece of work took through those systems. And they turn that path into measures: how long things take, where they wait, how often they come back.
That is genuinely useful, because the trace already exists and nobody has to fill in a timesheet to produce it. It is also the source of every limitation that follows. These tools measure the parts of the work that happen to pass through a system. A design decision argued out in a meeting, a dependency nobody owns, a team that has quietly stopped disagreeing with its lead — none of that appears, and no amount of dashboard will surface it.
The three jobs people actually buy this for
Almost every purchase in this category is driven by one of three needs. They look similar in a demo and are quite different in practice, and knowing which one is yours saves you from comparing feature grids.
Reporting upward. Someone outside engineering wants a number. What matters is that the definition is stable and defensible, not that it is deep. The risk is a metric that looks authoritative and means nothing.
Diagnosing delivery problems. You know things are slow and want to know where. What matters is granularity — being able to see that review is a four-day queue while coding is half a day. This is where the category earns its keep.
Cost and capitalisation reporting. Finance needs engineering effort split across projects. What matters is that the numbers survive an audit, which is a different bar entirely.
If your honest answer is the first one, be sceptical about whether you need a platform. A recurring query against the data you already have will produce one chart at a fraction of the cost, and the whole category is priced for the second and third jobs.
What separates the good ones
Feature lists in this category are nearly identical, so they are close to useless for choosing. Three things genuinely differentiate, and none of them are usually on the comparison page.
What the unit of measurement is. Team-level or individual-level. This is the single most consequential design decision in the product and it is rarely stated plainly — see below.
What happens when a definition changes. Teams reorganise, repos split, a workflow gains a stage. A tool that silently recomputes history makes your trend line a lie; a tool that handles it explicitly is worth paying for.
Whether it explains or just displays. Showing that cycle time rose is easy. Showing that it rose because review wait doubled after two people left is the part that changes a decision.
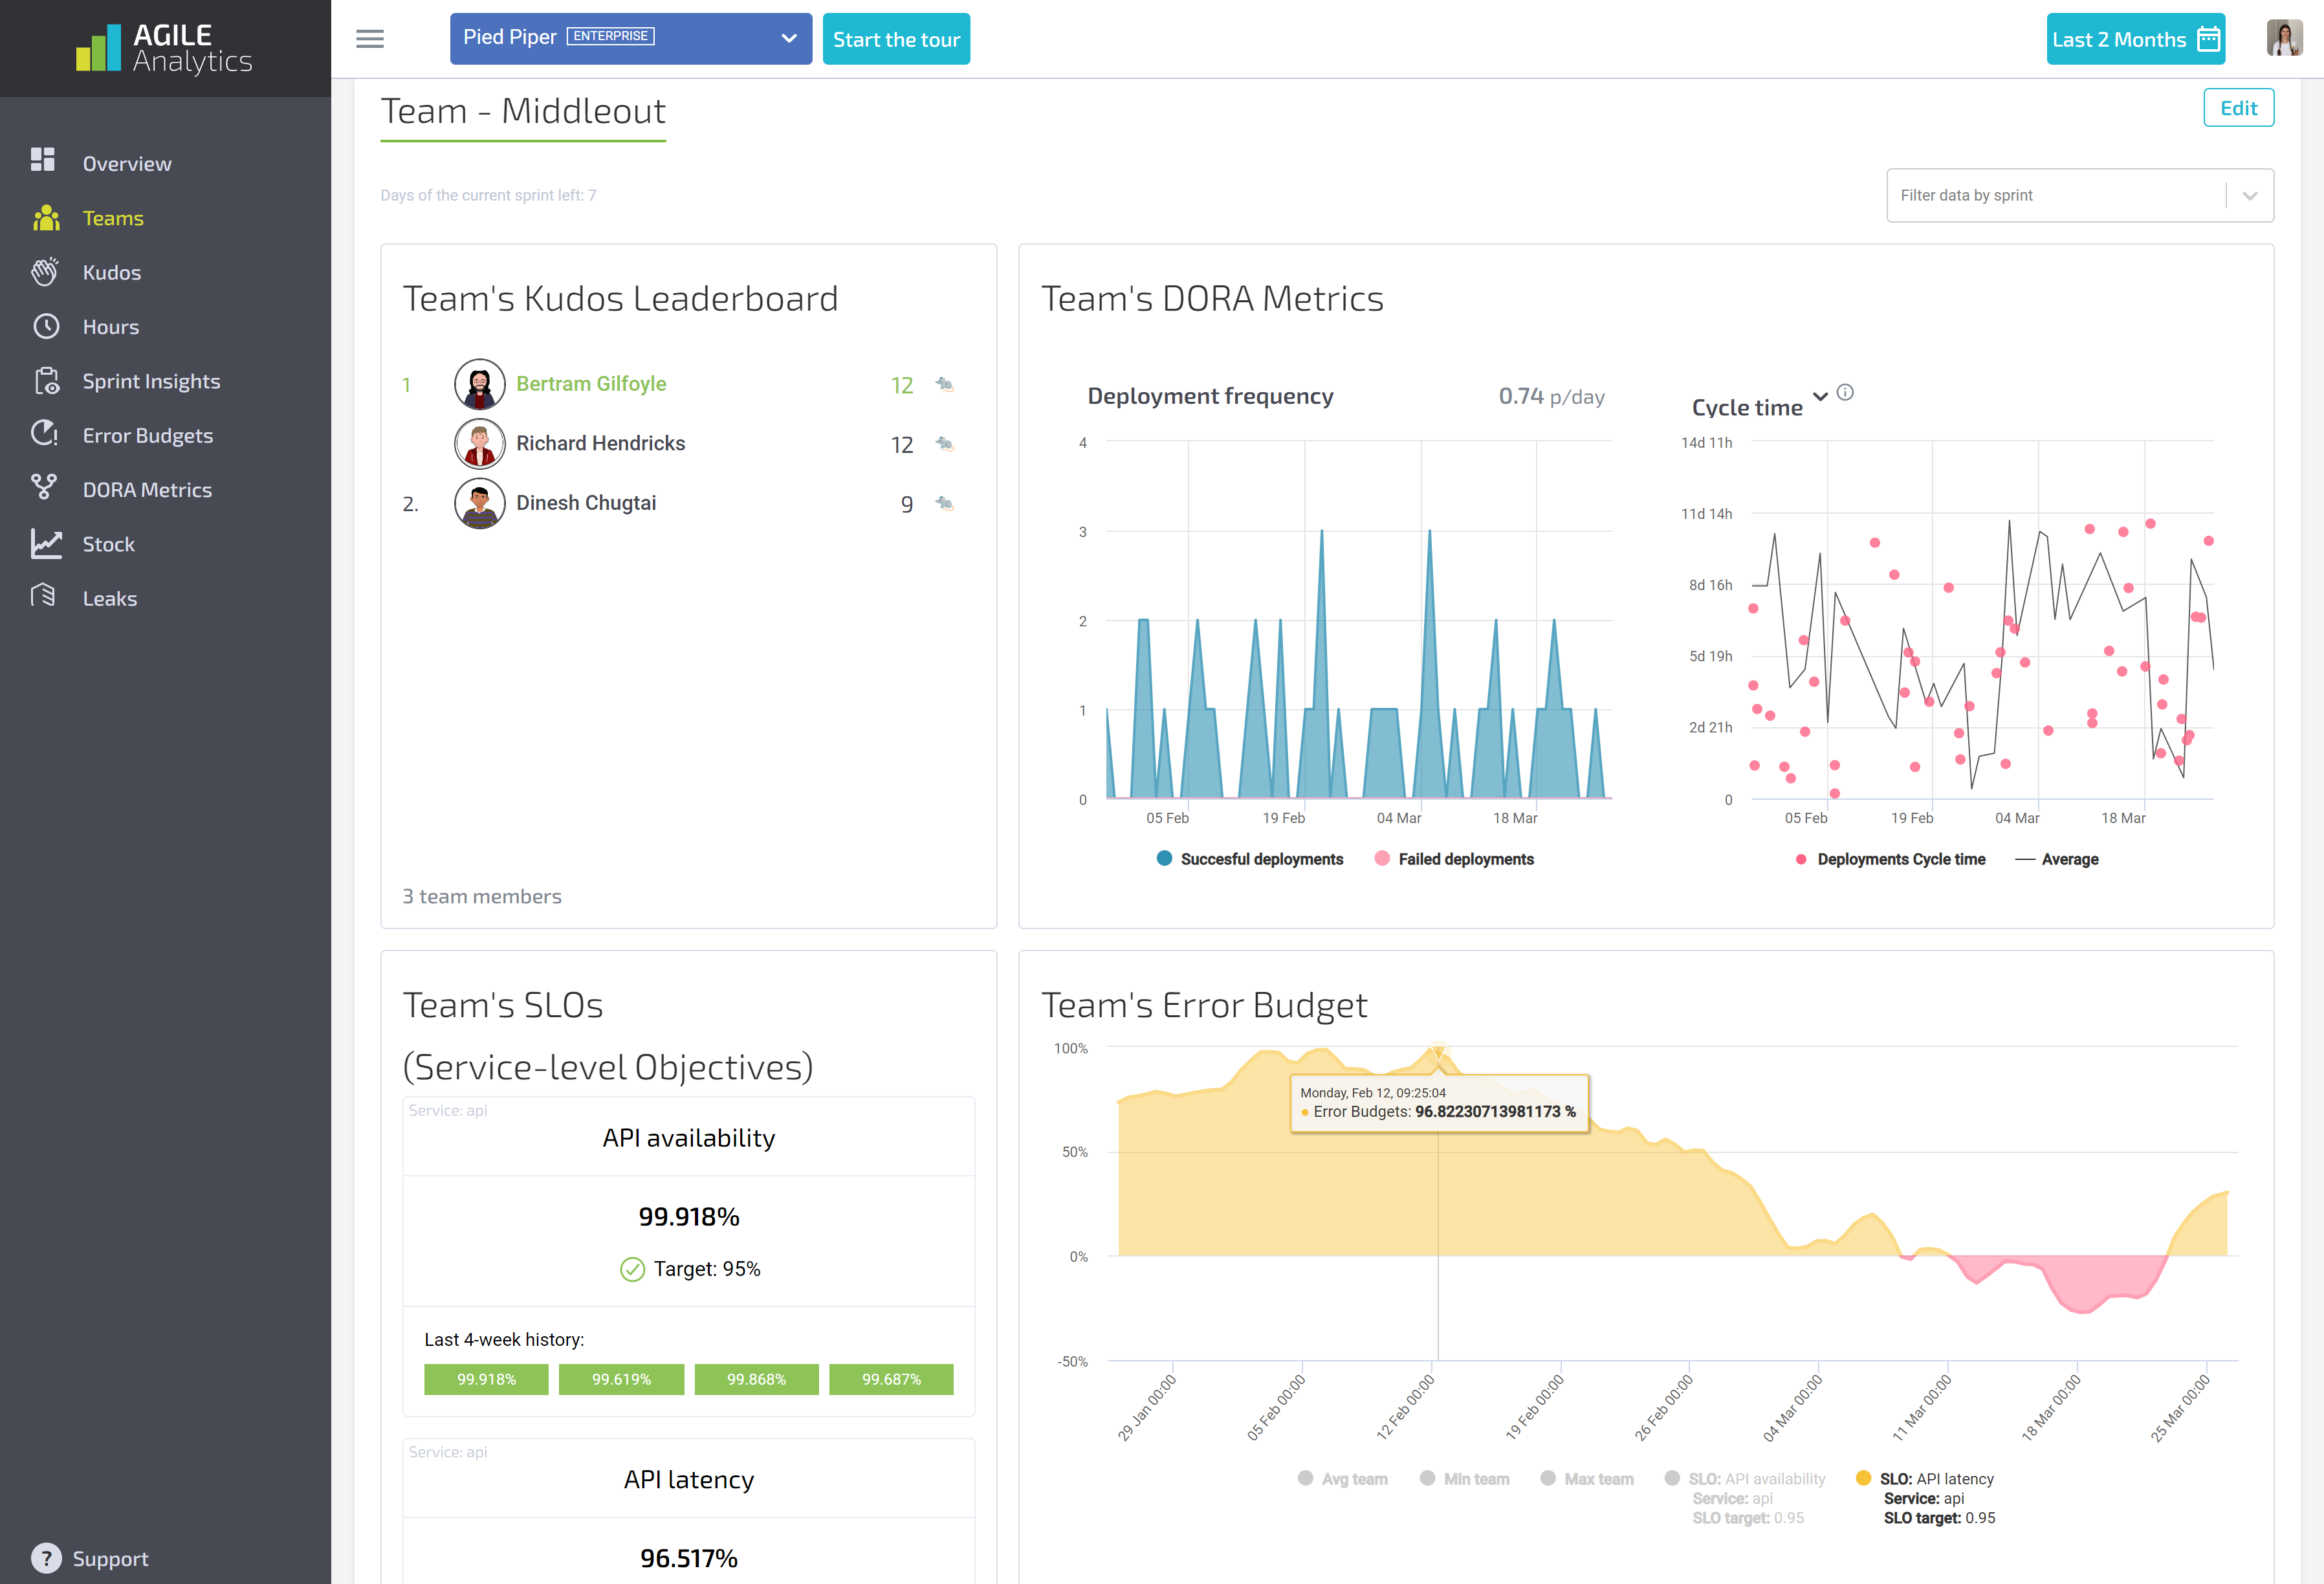
Agile Analytics
The failure modes nobody sells against
This is the section we would want to read before buying, so it is the longest one here. None of these are hypothetical; they are the common ways this goes wrong.
The dashboard nobody opens
By far the most common outcome. The platform is bought, connected, configured, demoed once — and then nothing changes, because no recurring meeting has a slot where the data is looked at and acted on. The tool is not the hard part. The operating rhythm around it is, and it is the part that no vendor can install for you.
The diagnostic is simple: if delivery data disappeared tomorrow, would any regular decision be made differently? If not, you do not have a measurement problem yet.
Measuring individuals
Several tools in this category can rank developers by commits, lines, review volume or a composite score. Some market it. Our position is that this is a mistake, and it is worth being explicit about why rather than just disapproving.
Software delivery is a queueing system, and most delay in a queueing system comes from the structure of the queue rather than the speed of the workers. When you rank individuals you are attributing a system property to the people inside it. What follows is predictable: people optimise the measured thing, pull requests get smaller and more numerous, review gets rubber-stamped, and the number improves while delivery does not. You also lose the ability to hear about problems, because reporting one now costs you personally.
If you take one thing from this article: whatever you buy, keep the unit of measurement at team level or above.
The metric that became a target
Goodhart's law is not a clever aside here, it is the main operational risk. Put deploy frequency on a leadership slide and deploy frequency will rise — through smaller, emptier deploys if that is the cheapest way to move it. The measure stops describing reality at the moment it starts being used to judge people.
The practical defence is to pair every throughput measure with a quality measure and always read them together. Deploy frequency alongside change failure rate (the share of releases that need a fix). Cycle time alongside rework. A team can game either one alone; gaming both at once is just doing the work properly.
Buying data you have no plan for
The category makes it easy to collect two hundred metrics and use none. Decide in advance which two or three actually inform a decision, and treat the rest as diagnostic. Diagnostic means available when you are investigating something — not on a dashboard, and never in a report to anyone outside engineering.
How to evaluate one
Which of the three jobs above is yours? Say it out loud before the first demo.
Ask what the unit of measurement is, and whether individual-level views can be turned off entirely.
Ask what happens to historical data when a team or workflow changes.
Bring two or three real questions you cannot currently answer, and ask them to answer them with your data during the trial.
Ask who inside your organisation will look at this weekly. If there is no name, stop — the tool is not the missing piece.
Check how you get your data out, and confirm it before you sign rather than at renewal.
That last one matters more than it used to. Tools in this category do get retired — Pluralsight Flow is being wound down, and its customers are discovering that proprietary metrics do not survive a migration.
Where Agile Analytics fits
We measure delivery — DORA metrics, cycle time (from first commit to merged), error budgets — at team level, and we work alongside the teams using them. That combination is the reason to talk to us and also the reason not to.
If you want a self-serve dashboard you configure yourself and never discuss with anyone, several tools do that well and you should buy one of them. If the failure mode you recognise is the first one on this page — data collected, dashboards built, nothing changed — that is the problem we exist to solve. The platform is the smaller half of it.
Worth reading next: how to measure software development productivity without the measures turning into targets, and whether developer experience needs metrics at all.
Less guessing. More shipped software.
Measure faster — lead time, review wait and deployment frequency per team, every sprint
Guard quality — change failure rate, MTTR and Error Budgets
Prove the gain — feature work versus maintenance, from your own data
See it in 30 minutes — on your own data, not a slide deck