Agile Data Blind Spots: What You're Not Seeing in Jira

Published on 11 June 2026 by Zoia Baletska

Jira dashboards tend to create a dangerous sense of confidence. The board moves. Tickets close. Velocity looks stable. Delivery appears predictable enough. From a reporting perspective, things seem under control.
The problem is that Jira only measures what makes it into Jira properly. Most teams are working with incomplete delivery data without realising it, and those gaps quietly distort every metric built on top of it.
Hidden Dependencies and Invisible Blockers
A ticket can technically be “In Progress” while being completely stuck. Maybe it depends on another service team. Maybe approvals are waiting. Maybe a blocker lives in a comment thread nobody reads anymore. Sometimes the actual dependency exists only in Slack conversations or someone’s memory. Jira rarely captures this context cleanly.
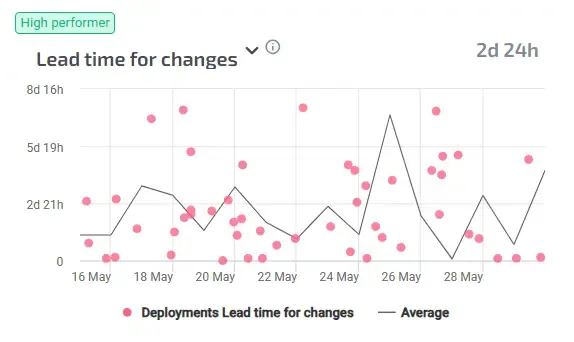
As a result, cycle time starts looking inconsistent. Teams assume estimation problems or execution issues, while the real cause is often hidden, waiting time that never became structured data. When dependencies are not tracked, delivery metrics become harder to trust because delays look random even when they are highly predictable.
Work That Never Gets Tracked
Most teams underestimate how much work never appears on the board: support requests interrupt planned work, production incidents consume half a sprint, engineers spend time helping teammates, fixing old configurations, answering questions, joining urgent calls, or investigating issues that never become tickets. The result is familiar: sprint commitments feel unrealistic, delivery slows down, and velocity becomes noisy. But Jira still reports the sprint as if planned work was the only thing happening.
This creates a measurement gap. Teams appear slower than they actually are because part of the work simply never existed in the data. Context switching makes this even harder to spot. A developer working across five unrelated streams may look underutilised on paper while spending entire days moving between interruptions.
Data Quality Problems Create False Signals
Bad data quietly creates bad decisions.
If one team estimates in hours, another in story points, and a third barely estimates at all, comparing velocity becomes meaningless. Tickets skipped between statuses distort flow metrics. Work updated only before sprint reviews creates the illusion of sudden progress. None of this sounds dramatic individually, but together it shapes the story leadership sees.
Teams start optimising around distorted signals:
-
velocity inflation
-
oversized tickets
-
rushed status changes
-
work split for reporting purposes rather than delivery reasons
Eventually, discussions shift toward explaining numbers instead of improving flow.
The Real Cost of Blind Spots
Measurement gaps rarely stay isolated. When blockers are hidden, work goes stale. When support work stays invisible, planning becomes unreliable. When ticket quality declines, metrics slowly stop reflecting reality. This is one reason delivery improvements often fail. Teams try solving the wrong problem because the data points are somewhere else.
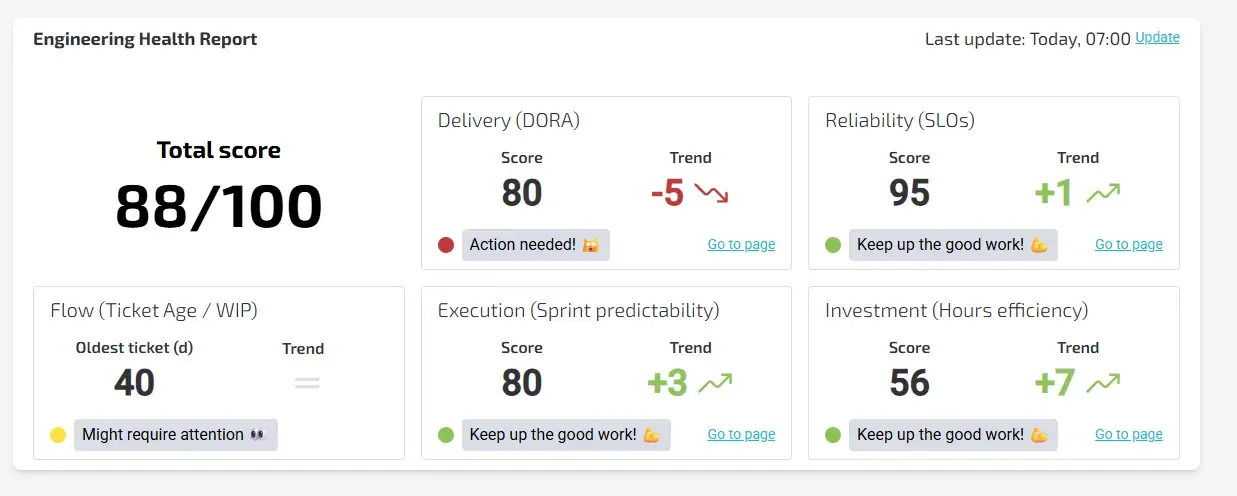
Platforms like Agile Analytics help surface some of these blind spots by continuously analysing ticket flow, ageing, dependencies, work types, and delivery patterns across systems. The goal is not more dashboards. It is understanding what the existing dashboards are missing.
Because if the data is incomplete, even the best metrics eventually start telling the wrong story.
Supercharge your Software Delivery!
Implement DevOps with Agile Analytics
Implement Site Reliability with Agile Analytics
Implement Service Level Objectives with Agile Analytics
Implement DORA Metrics with Agile Analytics