What are Error Budgets?

Published on April 2022 by Arjan Franzen
Introduction
Error Budgets enable a large amount of autonomy for your software teams. these feature teams can steer priority based on the level of service that is currently being offered to stakeholders. This article will explain the basics of the concepts that enable Error Budgets. Furthermore it will demonstrate how to implement it using ZEN Software’s Agile Analytics.
When implementing Error Budgets for your teams a number of things needs to be setup up in both the team culture as well as in the tools.
SLI & SLOs are the driving concepts behind Error Budgets
This article will tell you all about what SLI, SLOs and Error Budgets are and how to implement them, let’s get started
Service Level Indicator
This indicator works with percentages. 100% is good, 0% bad. It measures a service level using the ratio of good vs valid events events

SLI: ratio of good vs valid events
so the simplest way to have your first SLI is to count all ‘good’ events as percentage of all ‘valid’ events.
What makes a ‘good’ and what a ‘valid’ event? This depends on what you are measuring: let’s start by measuring the availability of our service, load balancer side.
from the list of all the response-codes logged by the load balancer the following ‘good’ and ‘valid’ events can be distinguished:
a ‘good’ HTTP event are all HTTP response codes except 500-599
a ‘valid’ HTTP event is are HTTP return codes
SLI Availability
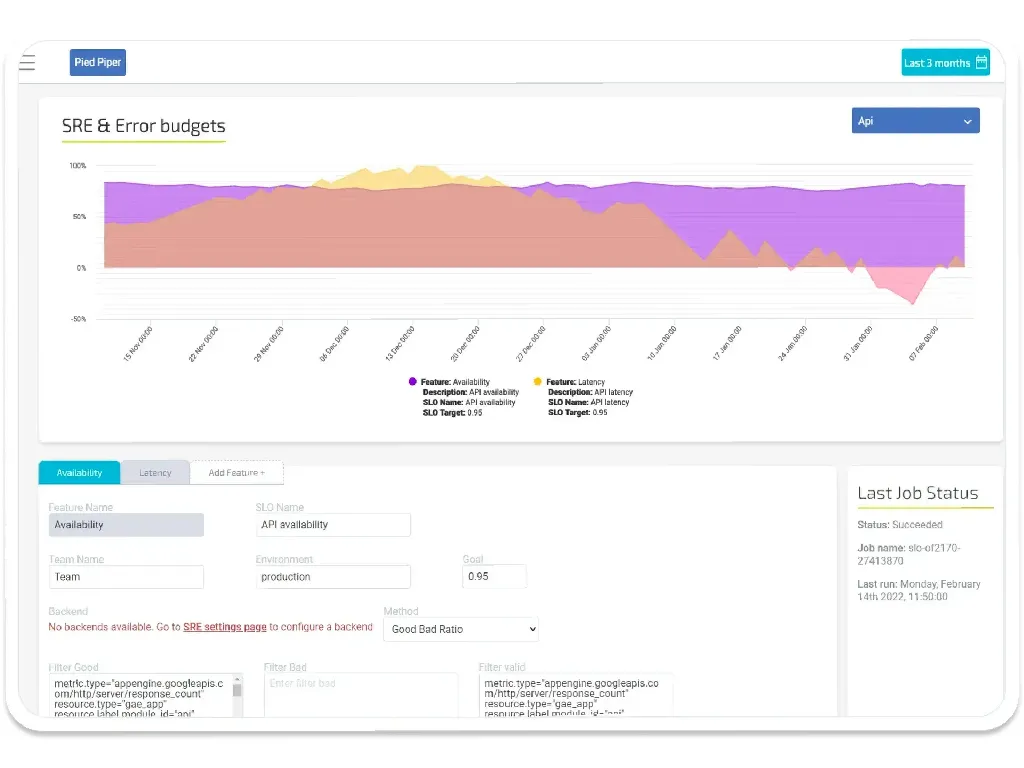
so we are now ready for our first SLI configuration in Agile Analytics
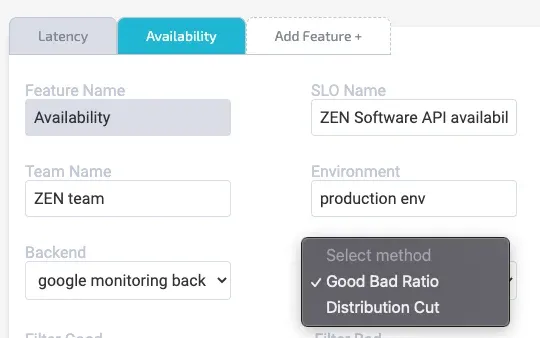
We create a new ‘feature’ called “Availability” and describe what aspect we are monitoring.
Since we’re measuring Availability we have 1 indicators; 1 for Good, 1 for Valid events.
our measurement method is therefore “Good Bad Ratio”
- Good Event are { all HTTP return codes: 429, 200-208, 226, 304 }
1 2 3 4 5 6 7 8 9 10 11 12 13 14 15 16project="<yourprojectid>" metric.type="appengine.googleapis.com/http/server/response_count" resource.type="gae_app" resource.label.module_id="api" (metric.labels.response_code = 429 OR metric.labels.response_code = 200 OR metric.labels.response_code = 201 OR metric.labels.response_code = 202 OR metric.labels.response_code = 203 OR metric.labels.response_code = 204 OR metric.labels.response_code = 205 OR metric.labels.response_code = 206 OR metric.labels.response_code = 207 OR metric.labels.response_code = 208 OR metric.labels.response_code = 226 OR metric.labels.response_code = 304)
- Valid Events are { all HTTP return codes }
1 2 3 4project="<yourprojectid>" metric.type="appengine.googleapis.com/http/server/response_count" resource.type="gae_app" resource.label.module_id="api"
to create the Feature for this service press:
done!
let’s move on to the next method, measuring a Latency SLI using distribution cut
SLI Latency
When measuring latency (how long does a request to your service take) please take this diagram, a long tail distribution, in the back of your mind:

a long tail distribution; X-> nr of ms, Y ^ nr of requests
This diagram shows a LARGE number of requests that take a few milliseconds and (hence the long tail) a very small nr of requests that take forever.
What we need to measure is, given a latency: how many requests are below and how many are above that latency.
How many requests ‘make the cut’ and how many simply take too long?
if we know that we can simply fill in the SLI formula:

SLI: ratio of good vs valid events
- ‘good’ events are fast enough to make the cut
- ‘valid’ events are all requests
Let’s configure this in Agile Analytics:
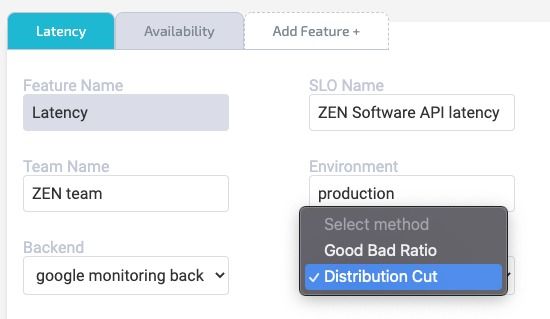
Next, what is the bucket that separates the weed from chaff?
In this example all events faster than 2048 milliseconds are ‘good’
next fill in the google monitoring code under ‘filter valid’
1 2 3project="<yourprojectid>" resource.labels.module_id="api" metric.type="appengine.googleapis.com/http/server/response_latencies"
press create and you’ve now created your second SLI!
let’s move on by setting some goals for your teams.
Service Level Objective
The service level objective is the reliability goal for the feature team to achieve. SLOs are the key to making data-driven decisions on feature team priority. The team needs a goal
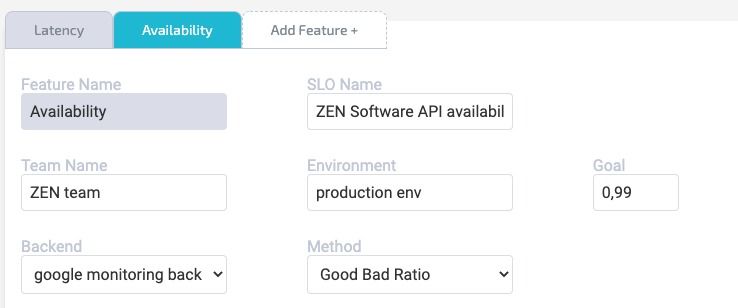
Setting a goal of 99% percent availability (here in screenshot) means that the service can have an allowed downtime/unavailability of
- 1m 26s (Daily)
- 10m 4s (Weekly)
- 43m 49s (Monthly)
these would be the numbers if we were using time as a basis for our measurement. We are using events and percentages instead but this gives you an idea how things would be if we were using a time-basis.
Simply said, the SLO game is a ‘game of nines’. How much reliability are you willing to have as a standard for your services granted that it can never be 100%.
We advise to start at 95% and work your way up to 99% then 99.9% or even higher to 99.99%.
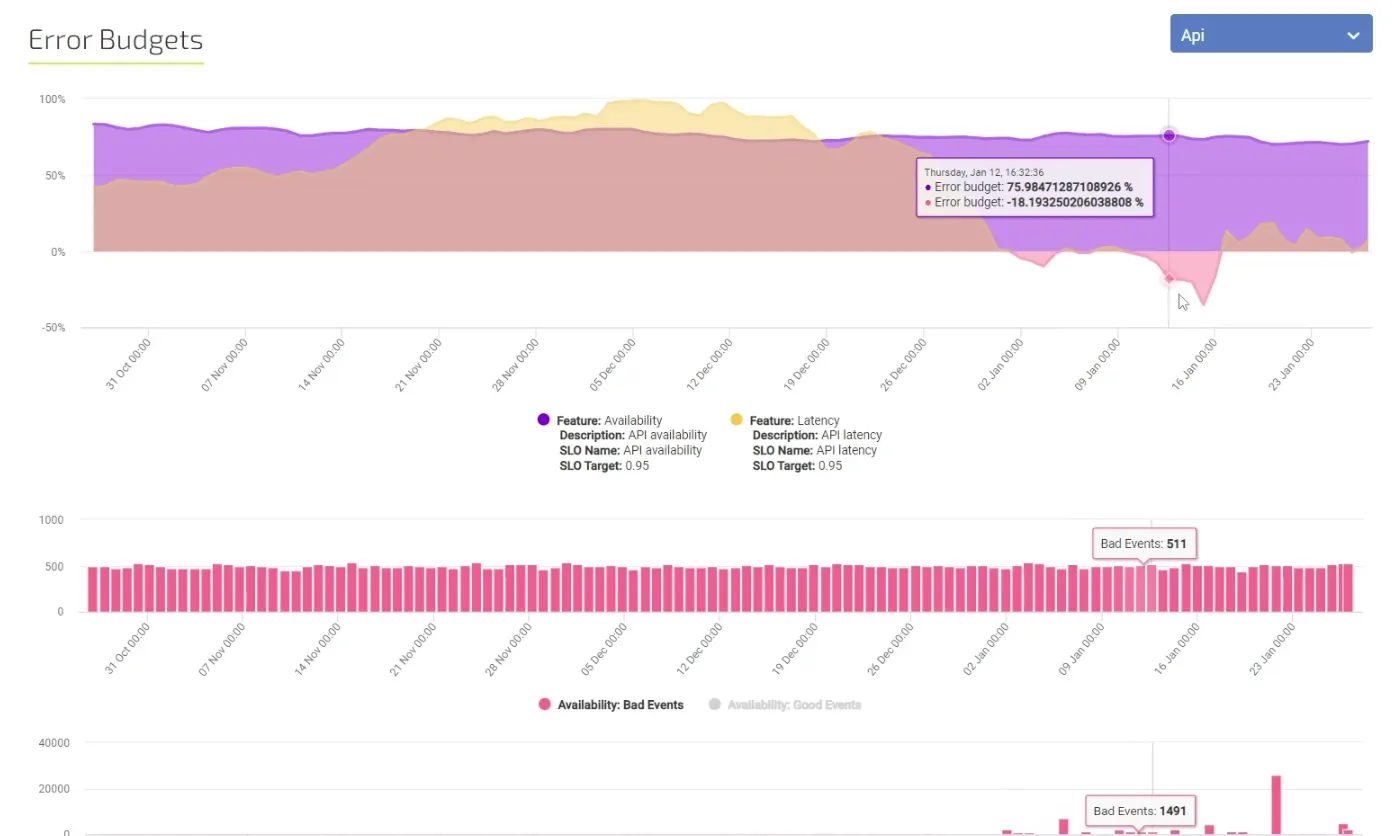
Then, the final instrument for the feature teams reaching (near full) autonomy for their priority decisions using data-driven insights are error budgets.
Error Budgets
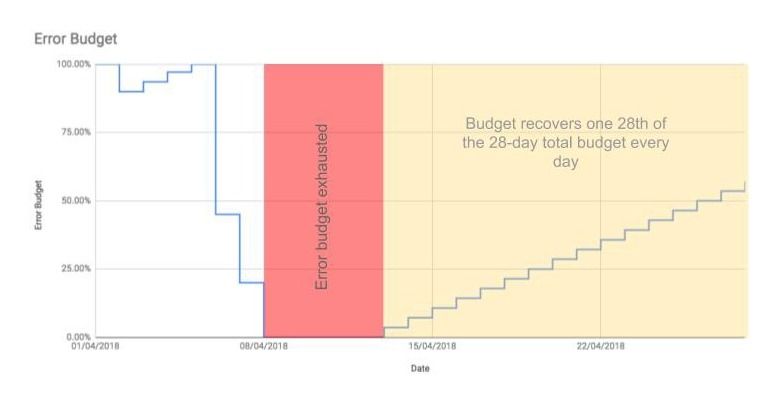
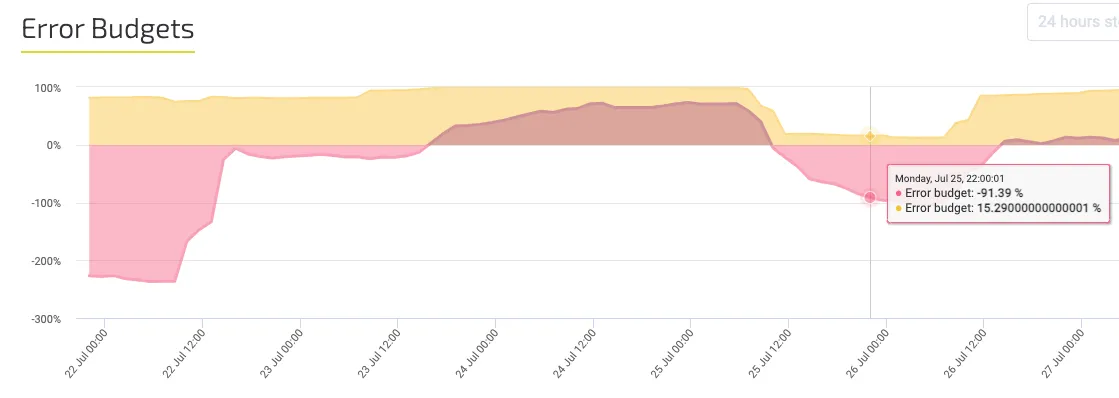
When the error budget is exhausted, the feature team focusses only on reliability improvements. no more features
This policy is not intended to serve as a punishment for missing SLOs. Halting change is undesirable; this policy gives teams permission to focus exclusively on reliability when data indicates that reliability is more important than other product features.
An SLO specifies the degree to which a service must perform during a compliance period. What's left over in the compliance period becomes the error budget. The error budget quantifies the degree to which a service can fail to perform during the compliance period and still meet the SLO.
An error budget is defined as 100% − SLO%. If your SLO target is 99.99%, your error budget is 0.01% within the compliance period. A service required to meet a 100% SLO has no error budget. Setting such an SLO is a bad practice.
Error budgets let you track how many bad individual events (like requests) are allowed to occur during the remainder of your compliance period before you violate the SLO. You can use the error budget to help you manage maintenance tasks like deployment of new versions. If the error budget is close to depleted, then taking risky actions like pushing new updates might result in your violating a SLO.
For example, if your SLO is for 85% of requests to be good in a 7-day rolling period, then your error budget allows 15% of the requests to be bad. If you get an average of, say, 60,480 requests in a week, your error-budget is 15% of that total, or 9,072 requests that are permitted to be bad. Your starting error budget is 9,072 requests, and as bad requests occur, the error budget is consumed until it reaches 0.
Error Budgets allow feature teams to be alerted when reliability becomes a risk to the team. Since the team is responsible for the software in production “you build it, you run it” the team is also accountable for both the feature development as well as the feature stability and performance.
Using SLI, SLO and Error Budgets neatly combines powerfull concepts from Site Reliability Engineering (SRE) to give your teams the tools to be autonomous, responsible and accountable.
Set up Error Budgets in 30 Minutes?
Linking your software development to the performance of your production systems has never been easier! Set up Error Budgets in 30 minutes.
Find out here how to do that.


