DORA metrics tools: what each one can actually measure

Published on 27 August 2026 by Zoia Baletska
Shopping for a tool to give you the four DORA metrics is unusually frustrating, because every product in the category has the same screenshot. Four tiles, four trend lines, a colour band telling you whether you are elite. The demos look identical, the pricing pages are not comparable, and nothing on any of them tells you the thing that actually differs between them.
What differs is which of the four numbers the tool can compute from data it genuinely has, and which of them it infers, estimates, or quietly asks you to enter by hand. That distinction does not appear in any feature grid, and it decides whether the dashboard is measuring your delivery or reflecting your admin.
The four metrics do not come from one place
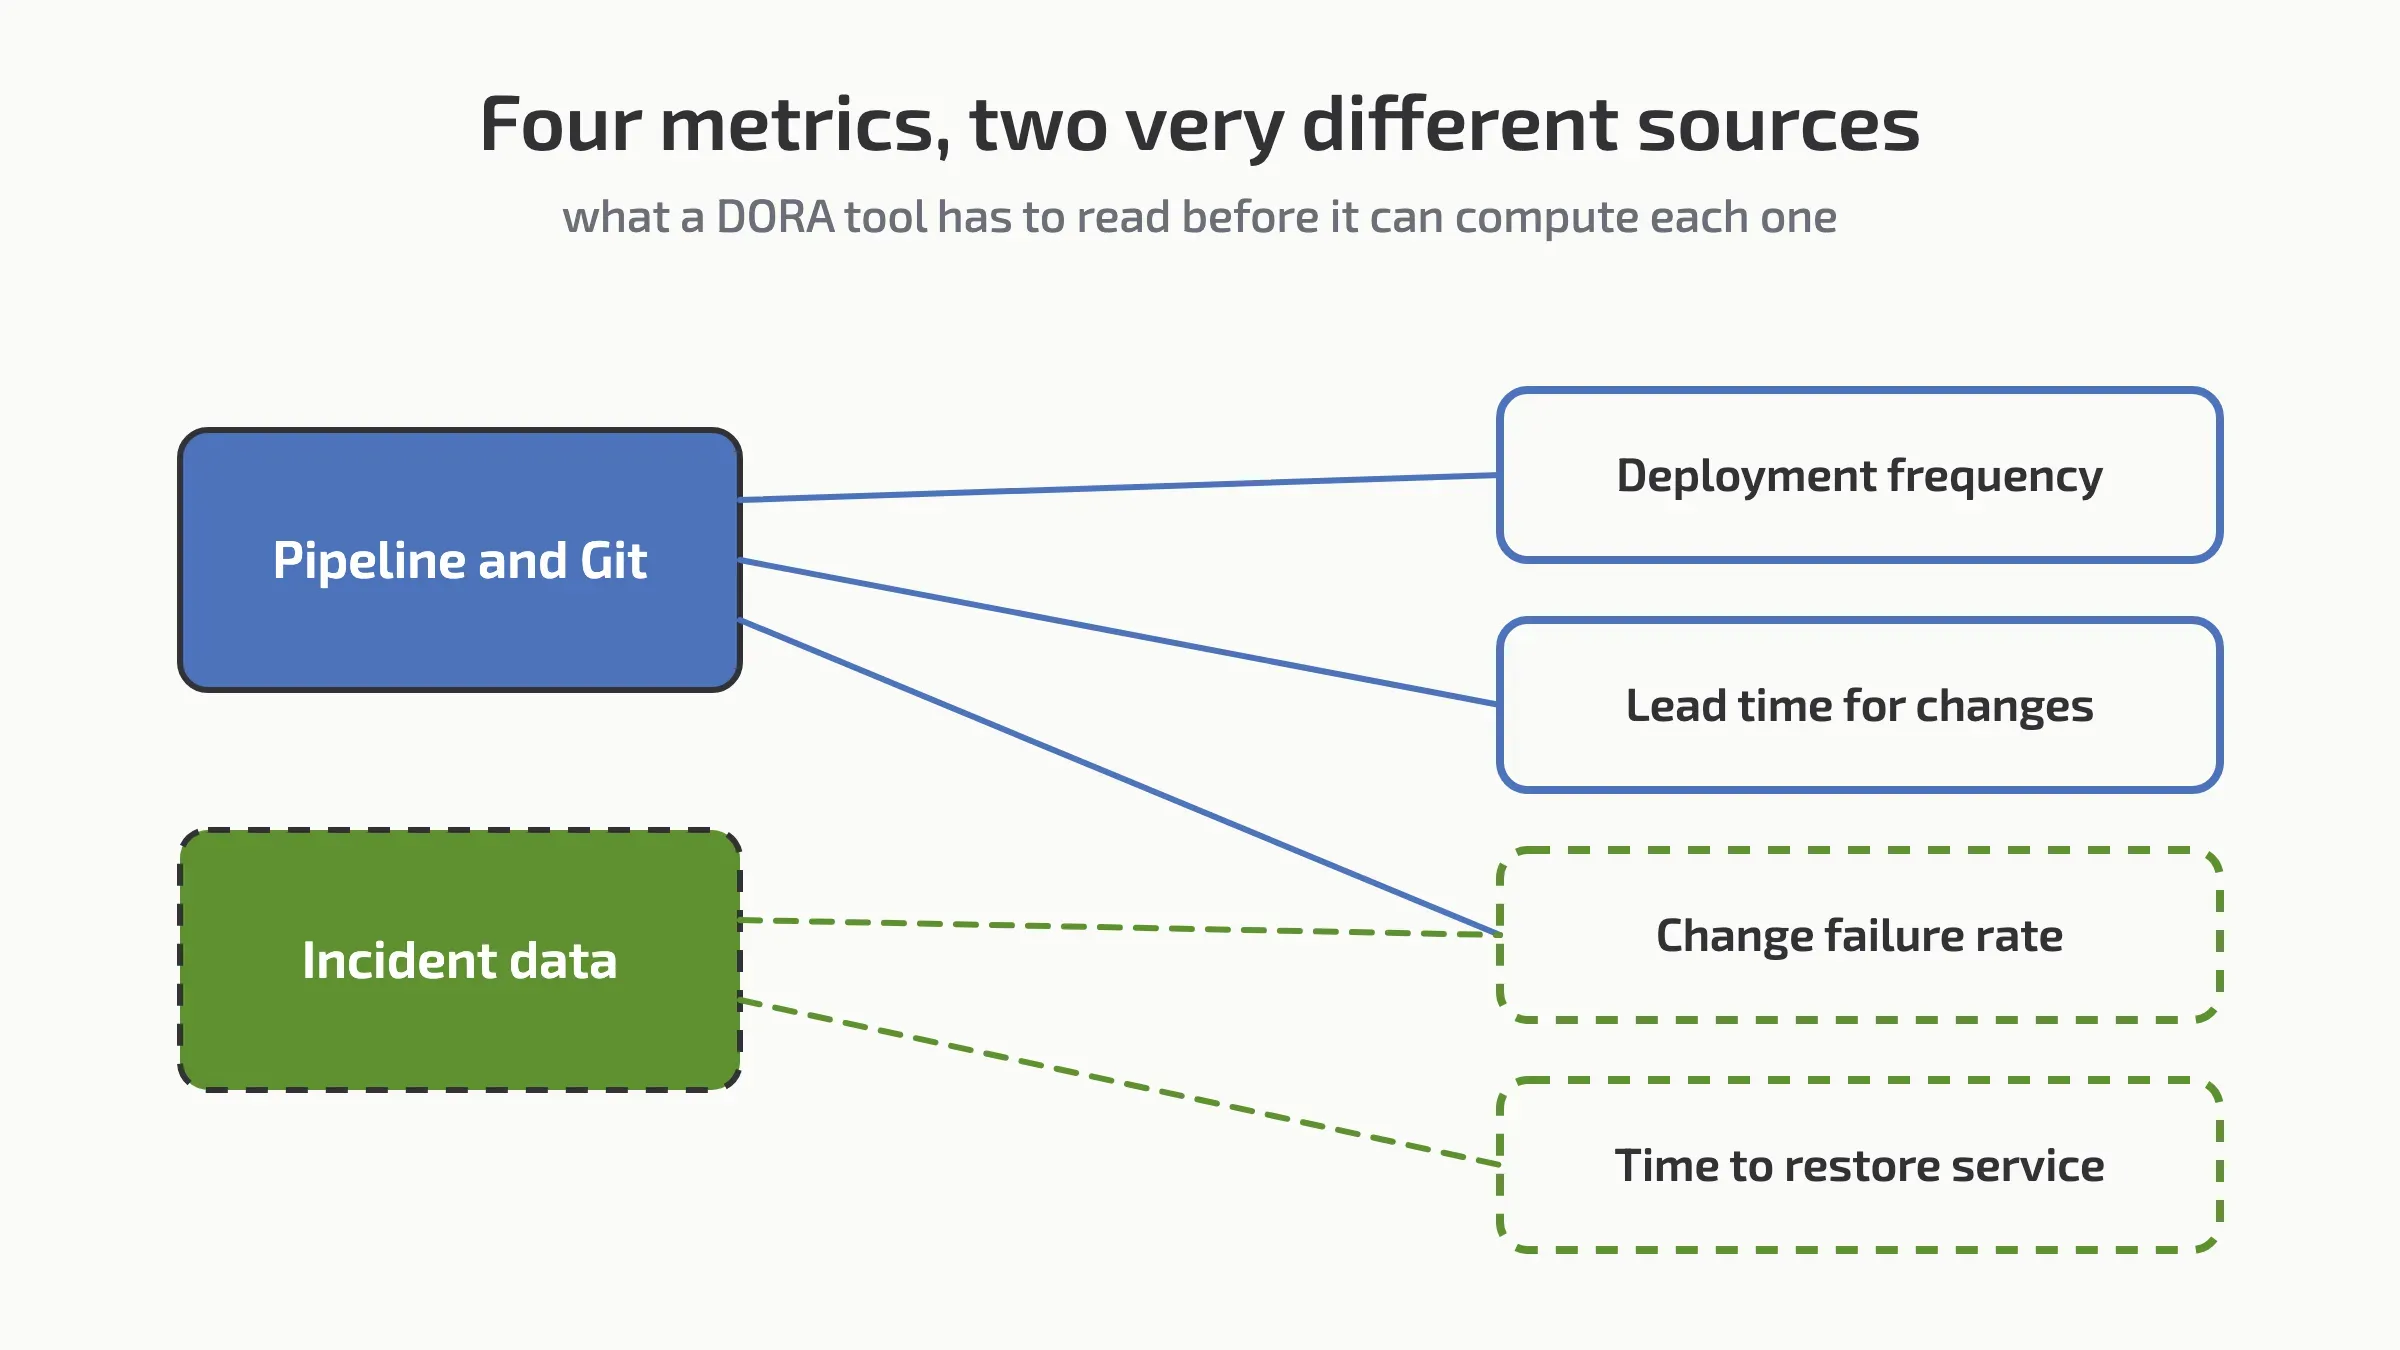
The reason DORA tooling varies so much in quality is structural. The DORA metrics are four measurements of one delivery system, but they are not four readings from one instrument. They are drawn from three different kinds of system, and most organisations run those three systems separately, owned by different people, with no shared identifier between them.
Deployment frequency — how often you release. Source: the deployment pipeline, or whatever records a release event.
Lead time for changes — commit to running in production. Source: version control joined to the deployment pipeline.
Change failure rate — what share of releases cause a degradation. Source: the deployment pipeline joined to incident management.
Time to restore service — how long recovery takes. Source: incident management, on its own.
Read that list as a shopping list rather than a definition and the market sorts itself out quickly. A tool that connects only to your Git provider can see one and a half of the four. A tool that connects to your CI/CD system (your build and deployment automation) can see two. Getting all four requires reading three systems and, harder than that, correctly joining them.
Two are nearly free. Two are not.
Deployment frequency is close to trivial. Something already emits an event every time you release; counting those events is not where the engineering difficulty lives. Lead time for changes is harder but tractable — it needs commits and deployments in the same timeline, with an agreed answer to which commits went out in which release.
The other two are a different problem, because both depend on knowing that an incident happened. Change failure rate needs more than that: it needs to know which release caused which incident. That link is a judgement someone makes after the fact. In most organisations it exists only in a human's head, a Slack thread, or a post-incident document — not as a field any tool can read.
So a product has three options. It can integrate with your incident tooling and inherit whatever discipline you already have. It can ask an engineer to tag failed deployments manually. Or it can infer failure from a proxy — a rollback, a revert commit, a hotfix (emergency fix) branch name — and present it alongside the other three as if it were the same kind of number.
None of these is dishonest, and the third is often a reasonable approximation. But a change failure rate derived from revert commits measures how your team uses Git, and it will move when someone changes their branching habits. It is worth knowing which of the three you are buying before the number reaches a board slide.
What to check on any DORA tool
These are the questions that separate products that look the same in a demo. None of them takes long to ask, and the answers are usually straightforward once someone is asked directly.
Where does the clock start for lead time? First commit, pull request opened, or ticket created? The difference is often weeks, and a tool that starts at the commit will report healthy lead time for work that spent a month waiting.
How does it decide a deployment failed? Read from incident data, tagged by hand, or inferred from reverts and rollbacks. Ask which, and ask what happens to the number when nobody tags anything for a fortnight.
Can it read your incident source? If time to restore service depends on an integration you do not have, two of the four metrics are decorative.
Does it segment, or is there one number for the organisation? A single company-wide deployment frequency is an average across teams with genuinely different constraints, and it hides the two that need attention.
Does it show distribution or only averages? A median lead time with a long tail is a different problem from a slow middle, and the average conceals which one you have.
Can you export the underlying events? If you can pull the raw deploys and incidents back out, you can check the arithmetic and you are not locked in. If you cannot, you are trusting the join you were just asking about.
The categories you will be shown
Search for DORA tooling and the results will mix at least four different kinds of product — Git and pull-request analytics, ticket and project analytics, developer experience platforms, and internal developer portals. They surface together because the buyer is often the same person, but they read different systems and therefore answer different questions. We have written up four kinds of tool that get sold as one category rather than repeat it here.
One framework distinction is worth carrying into any evaluation: DORA describes delivery outcomes and says nothing about how the work feels, while survey-based tools describe the feeling and cannot time a release. The two answer different questions, and a vendor claiming to cover both from a single data source deserves a follow-up question.
The case for building it yourself
It is worth saying plainly, because most articles on this subject are written by vendors and skip it: two of the four metrics are genuinely straightforward to compute in-house. If your deployments run through one pipeline and your commits live in one Git provider, deployment frequency and a workable lead time for changes are a scheduled job and a small table. Teams do this successfully and it can be the right answer, particularly while you are still deciding what you want the numbers for.
What you are buying from a product is the rest of it. The incident join that gives you the other two metrics. The segmentation. The handling of the edge cases that appear the moment a second pipeline or a monorepo (one repository holding many services) enters the picture. And not having to maintain any of it when the person who wrote the job moves on. If those things do not matter to you yet, a spreadsheet is a defensible starting point — and it will teach you what to ask for later.
Where Agile Analytics fits
We build one of these tools, so treat this section accordingly. Our particular choice is to read both ends of the work, the issue tracker and the delivery pipeline. So a piece of work is visible from the moment it is requested through to running in production. That is what makes the waiting time visible rather than only the building time, and the waiting is usually where the delay actually is. You can see how we handle the DORA metrics specifically, and where we sit relative to the alternatives, including the cases where something else is the better fit.
We are not the right answer for everyone in this market. If what you need is a service catalogue, an internal developer portal will serve you better. If you want survey-based sentiment on its own, a dedicated developer experience platform is a shorter route.
Start from the question, not the tool list
The four DORA metrics were designed as a diagnostic, not a scoreboard. That is worth holding onto while shopping, because it changes what a good tool looks like: not the one with the most integrations, but the one that can answer the specific question you already have.
If you suspect releases are too slow, deployment frequency and lead time for changes will tell you, and those are the two nearly every product measures properly. If you suspect the problem is stability — that you ship quickly and then spend the week recovering — then change failure rate and time to restore service are the numbers that matter. Those are exactly the two where products differ most. Work out which half of the question you are asking before you sit through the demo, and the shortlist gets considerably shorter.
Less guessing. More shipped software.
Measure faster — lead time, review wait and deployment frequency per team, every sprint
Guard quality — change failure rate, MTTR and Error Budgets
Prove the gain — feature work versus maintenance, from your own data
See it in 30 minutes — on your own data, not a slide deck