Engineering intelligence for AI-assisted teams
Where is your team losing money: waiting, people or production?
Agile Analytics reads Git, Jira, CI/CD and monitoring and shows per team where the money goes: pull requests that wait days for a review, sprints eaten by maintenance instead of features, deploys that break in production. So you can see whether the AI tooling — and the tokens you pay for — actually delivers faster and better.
Teams Reporting
Sprint Insights
DORA Metrics
SLO & Error Budgets
Kudos, and more!
Built for teams that build with AI
Flow. Where work waits: pull requests stuck in review, builds that fail, hand-overs between teams. Lead time, deployment frequency and Sprint Insights put a number on every queue.
Quality gates. What breaks in production: change failure rate, time to restore, Error Budgets against your SLOs — so faster shipping does not quietly become more incidents.
People. Who is being worn down: interruptions, unplanned work, Kudos and developer surveys. DORA's 2025 report found AI adoption leaves burnout and friction unchanged on its own — that part is still on you.
Team reporting is the key
By placing teams at the core of management, organizations can ensure alignment, foster collaboration, and empower decentralized decision-making, ultimately driving efficiency, innovation, and success across all levels of the organization.
Organizations can gain a nuanced view of their teams' effectiveness by considering project management, service levels, code delivery, and team communication.
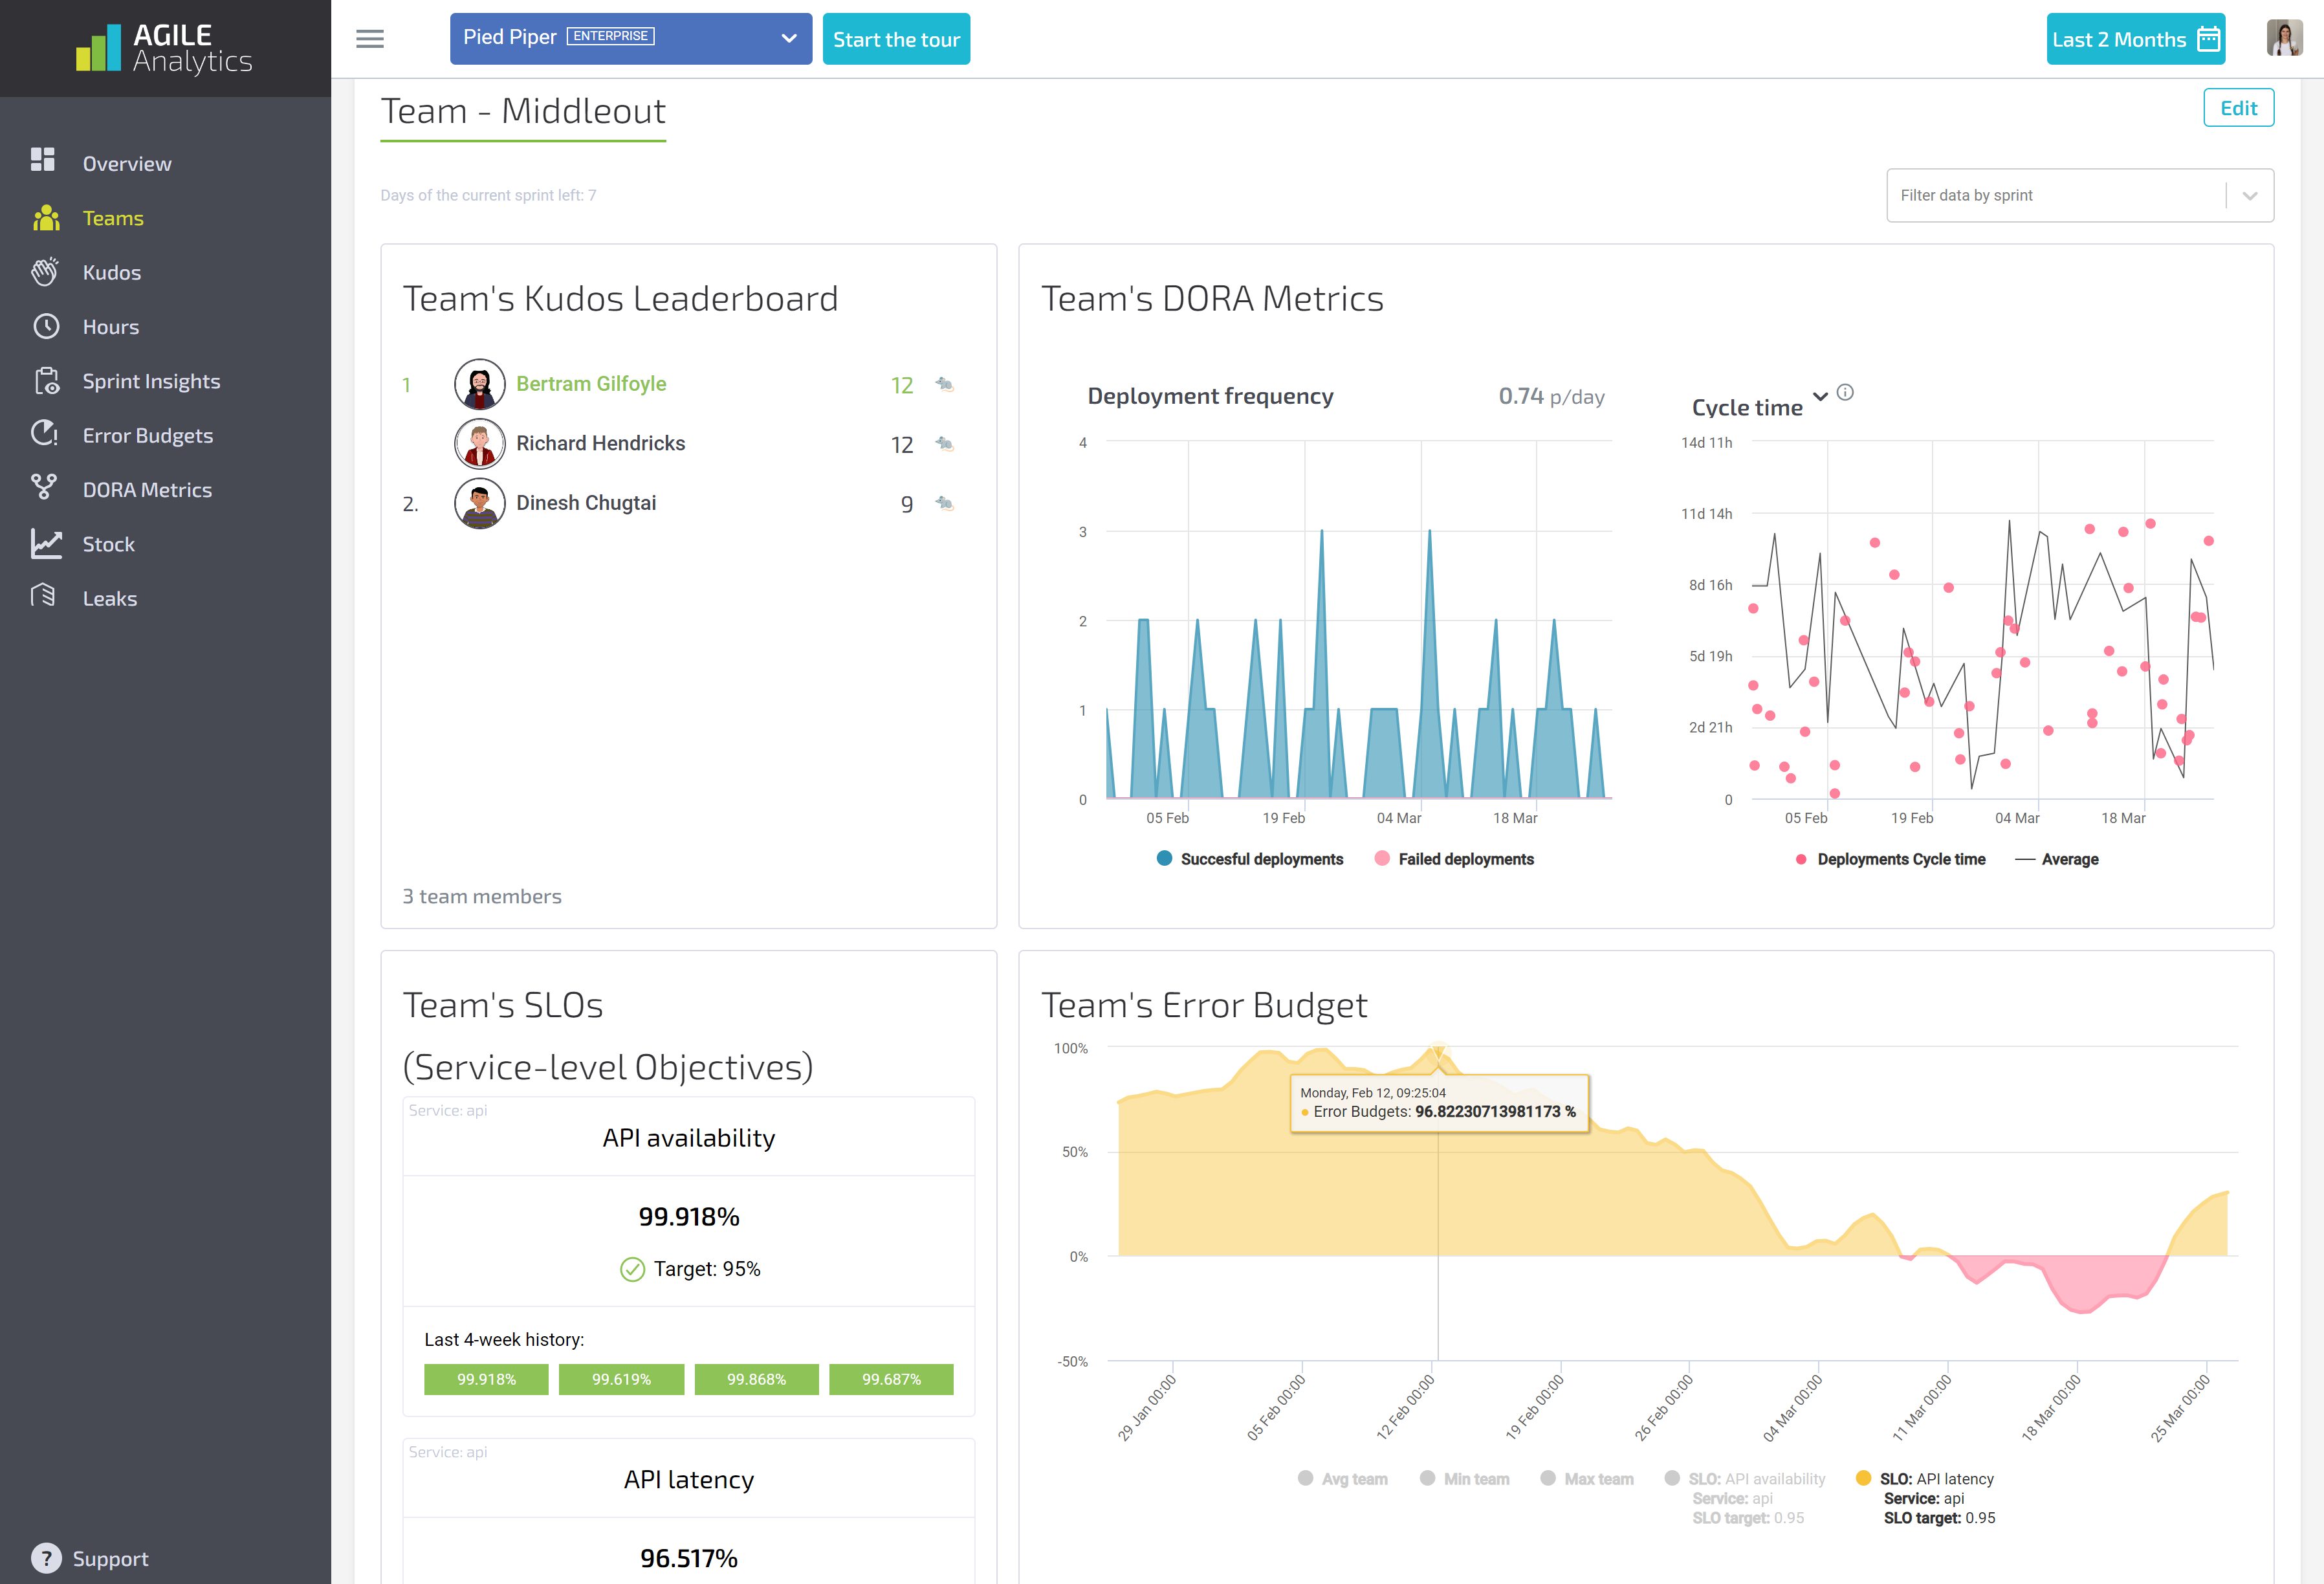
Sprint Reports for Continuous Improvement
Experience the power of Agile Analytics' Sprint Reports, delivering comprehensive insights at the end of every sprint.
With Agile Analytics, you receive a full report encompassing all metrics, allowing teams to identify areas for enhancement, celebrate successes, and adapt real-time strategies. Stay ahead of the curve and drive ongoing performance gains with actionable insights tailored to your team's needs.
Error budget
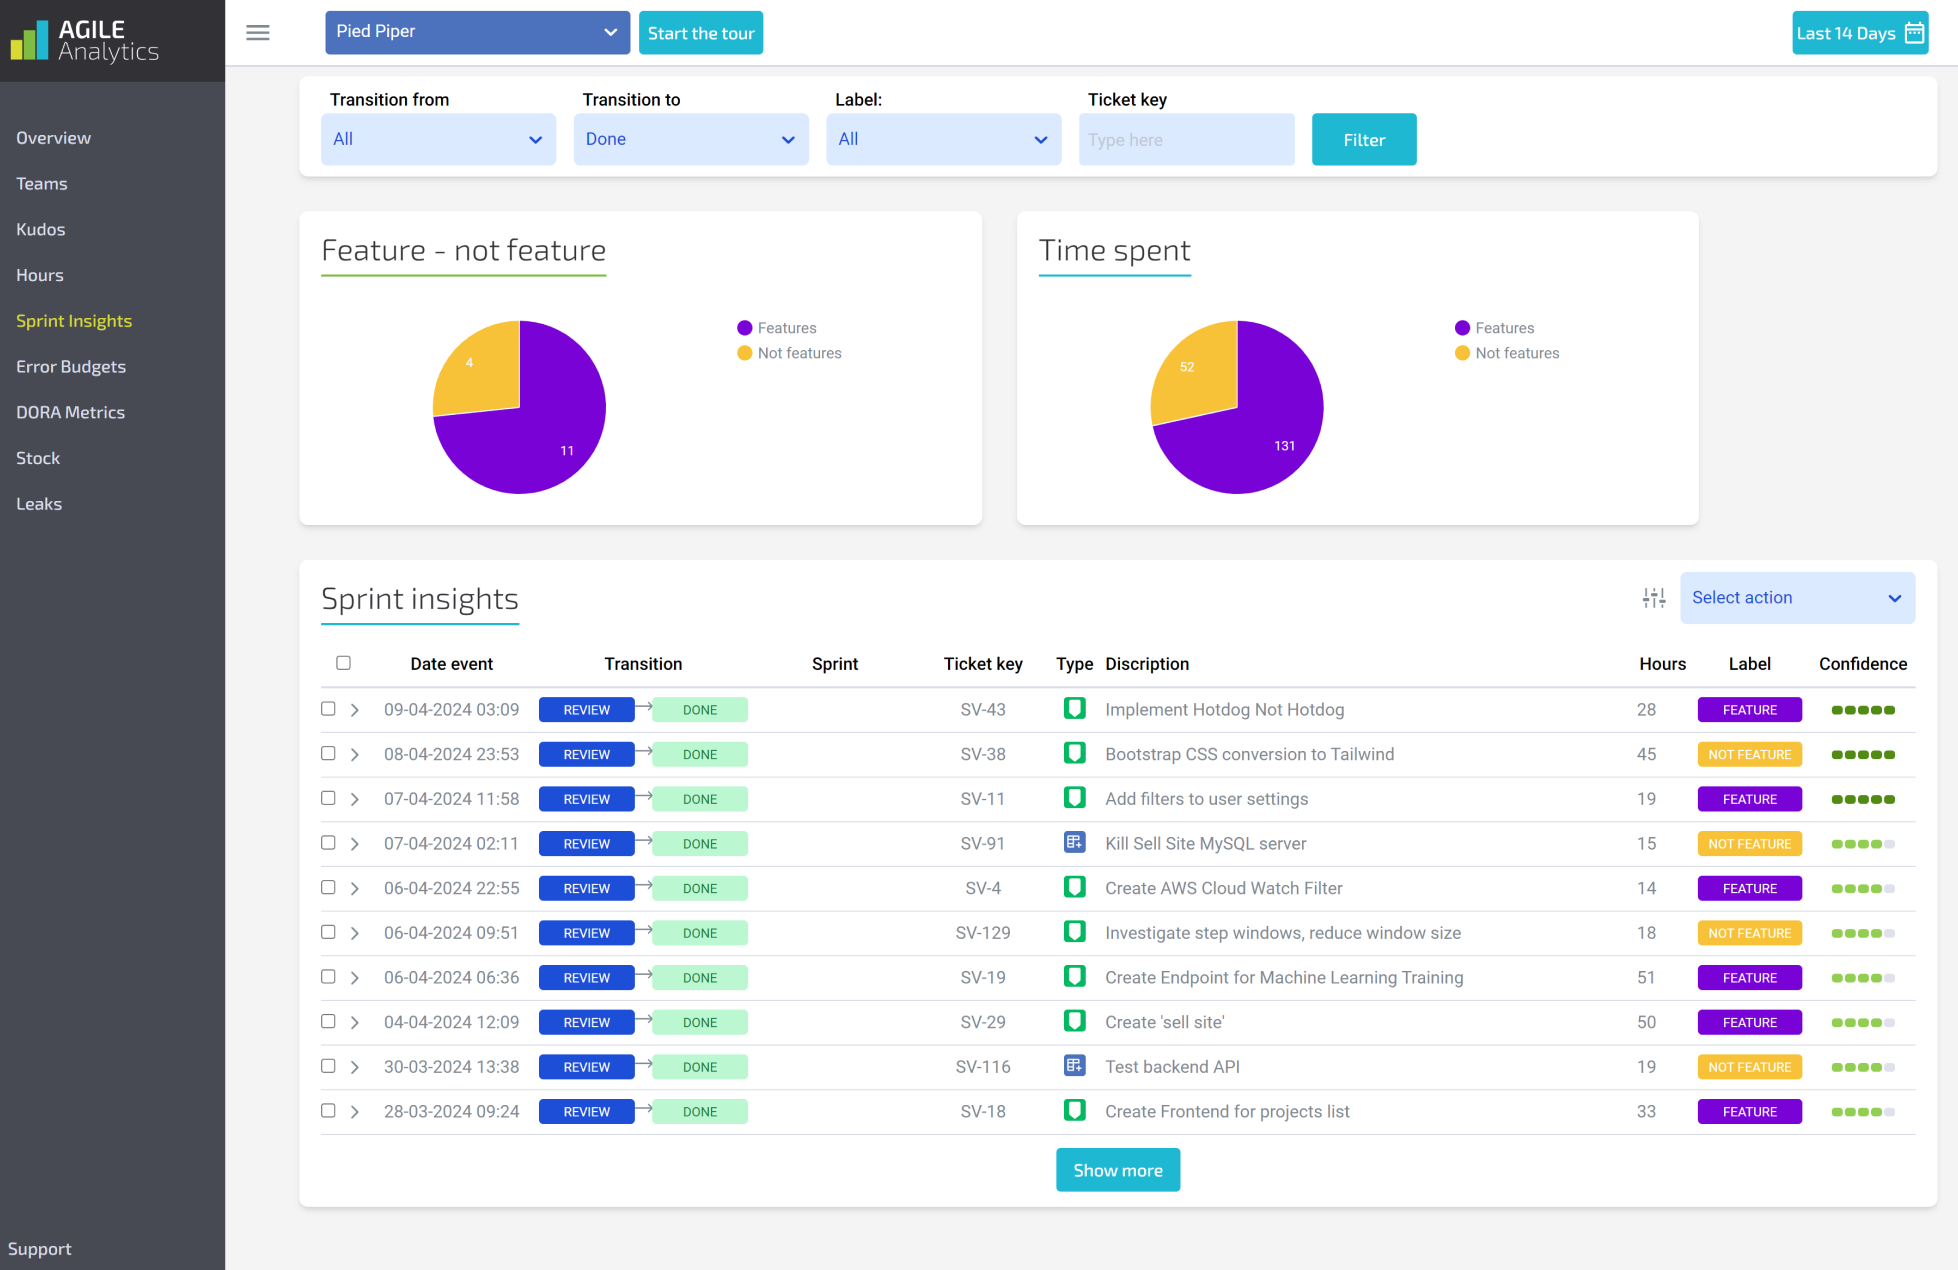
AI-generated changes ship faster than anyone can review them line by line. An Error Budget turns that into an explicit agreement: how much unreliability a service may spend per period before the team stops shipping features and pays down risk. Agile Analytics reads your SLOs from your monitoring, burns the budget as incidents land, and alerts the team before a customer does.
Monitor Service Levels. Monitor your team's service levels to ensure smooth performance and identify potential issues early on.
Monitor Service Level Objectives. Set clear goals with SRE (Site Reliability Engineering) and measure services' latency, availability, and other objectives to ensure your service's reliability and performance.
Control your Error Budgets. Agile Analytics alerts whenever an Error Budget is depleted and shows the team's aggregate of all the services it is responsible for. This makes sure teams have their management information for steering the team.
Sprint Insights
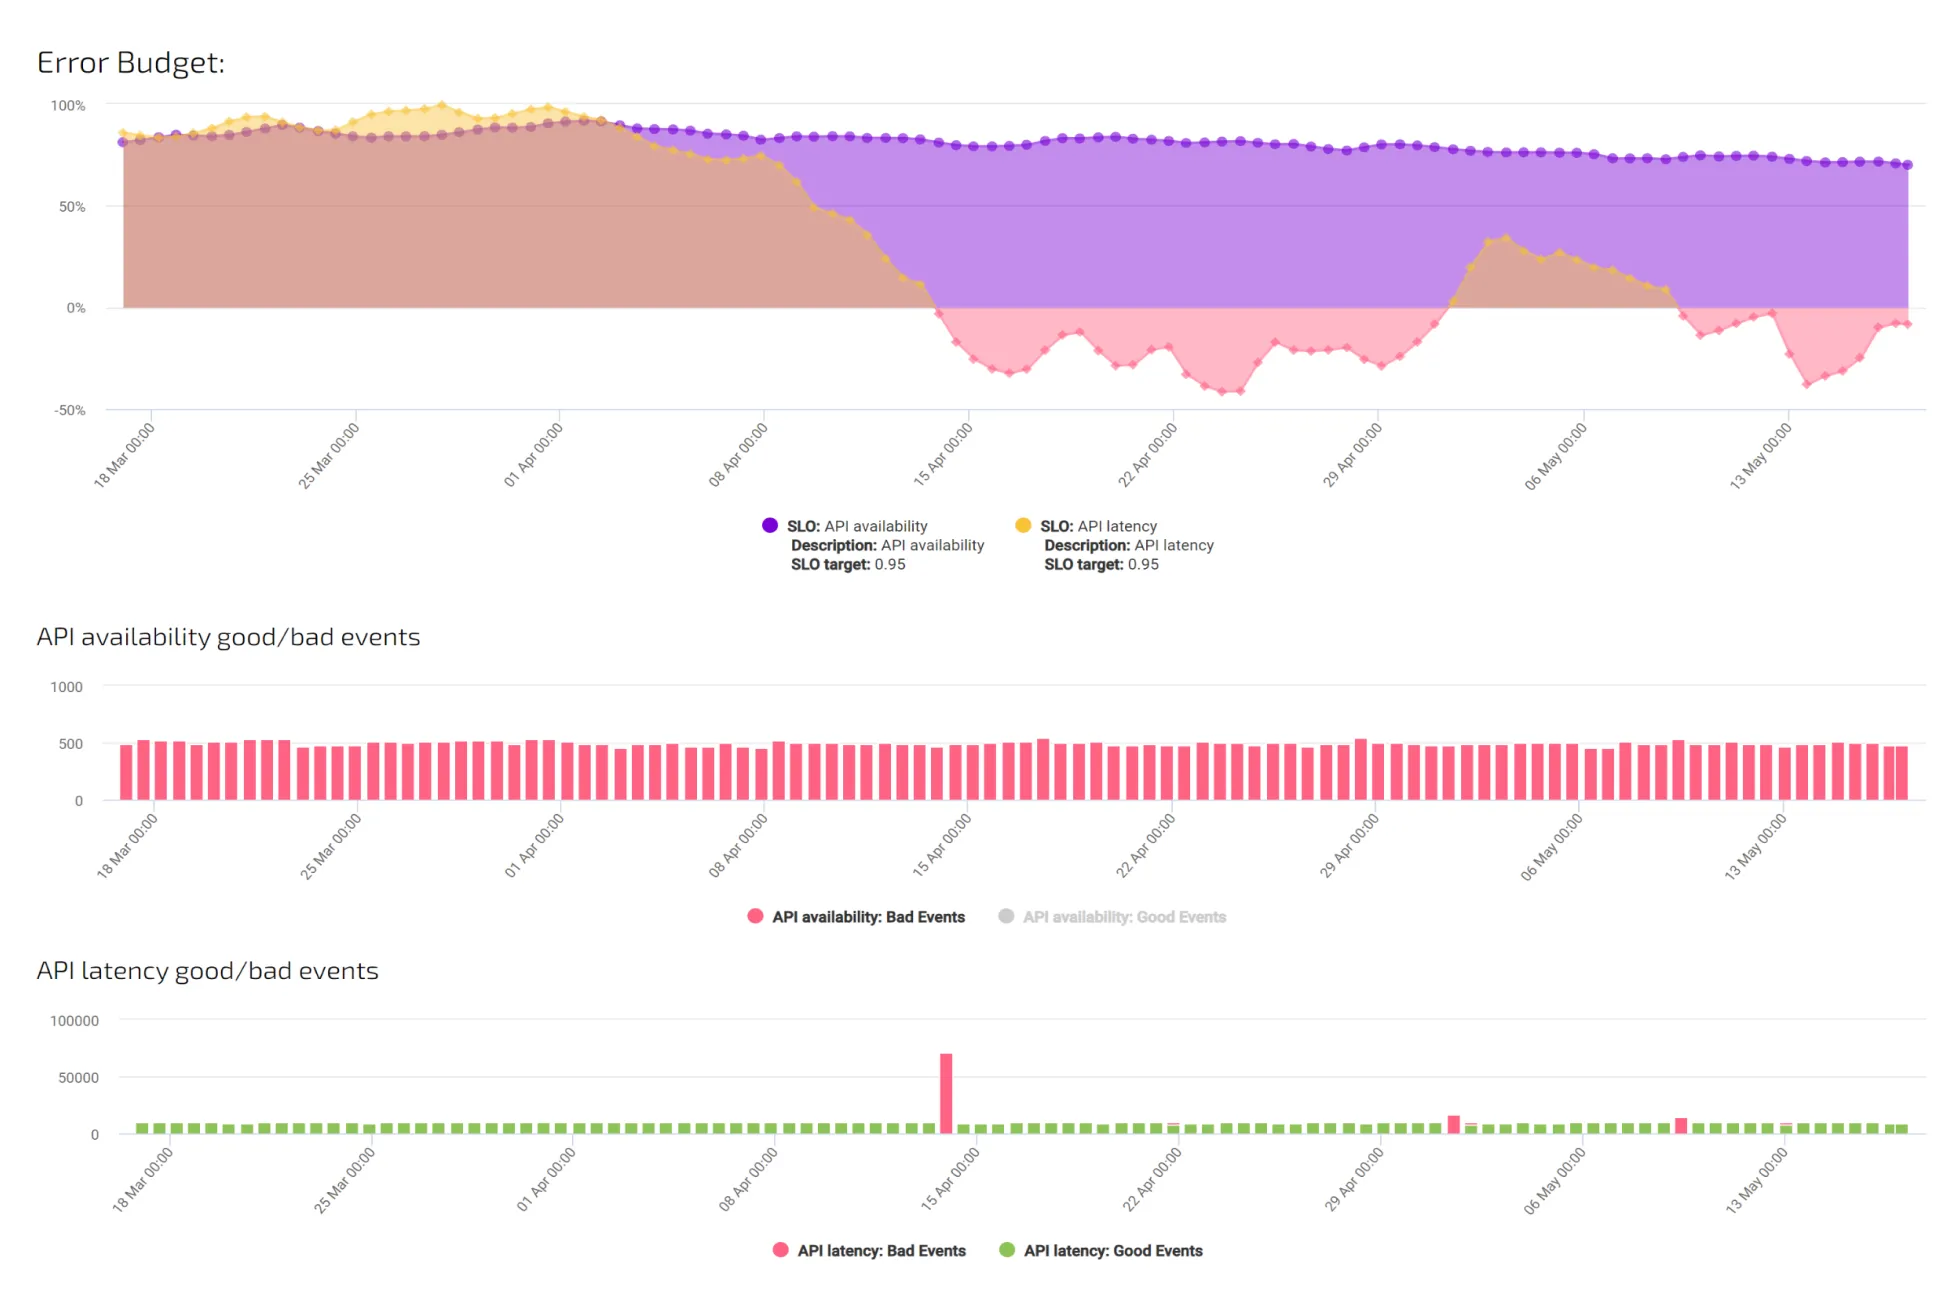
Sprint Insights classifies every Jira ticket as feature or non-feature work, so you can see what share of a sprint actually ships value — and whether that share moves as teams adopt AI. GitClear measured refactoring falling from 25% to under 10% of changed lines between 2021 and 2024; this is where that trend shows up in your backlog before it shows up in your incident log.
Enhanced ticket management. Measure the impact and service levels of completed tasks to gain insights beyond Jira's ticket flow, allowing for more comprehensive management of your team's workflow.
Streamlined Backlog Prioritization. Utilize Sprint Insights to prioritize backlog items efficiently, censuring timely execution of development changes and alignment with project priorities and service level objectives, thereby enhancing project management effectiveness.
Eliminate Process Bottlenecks. With Sprint Insights, you can identify and eliminate process bottlenecks, reducing waiting times and enhancing productivity by aligning team efforts with Agile principles and service level requirements.
DORA Metrics
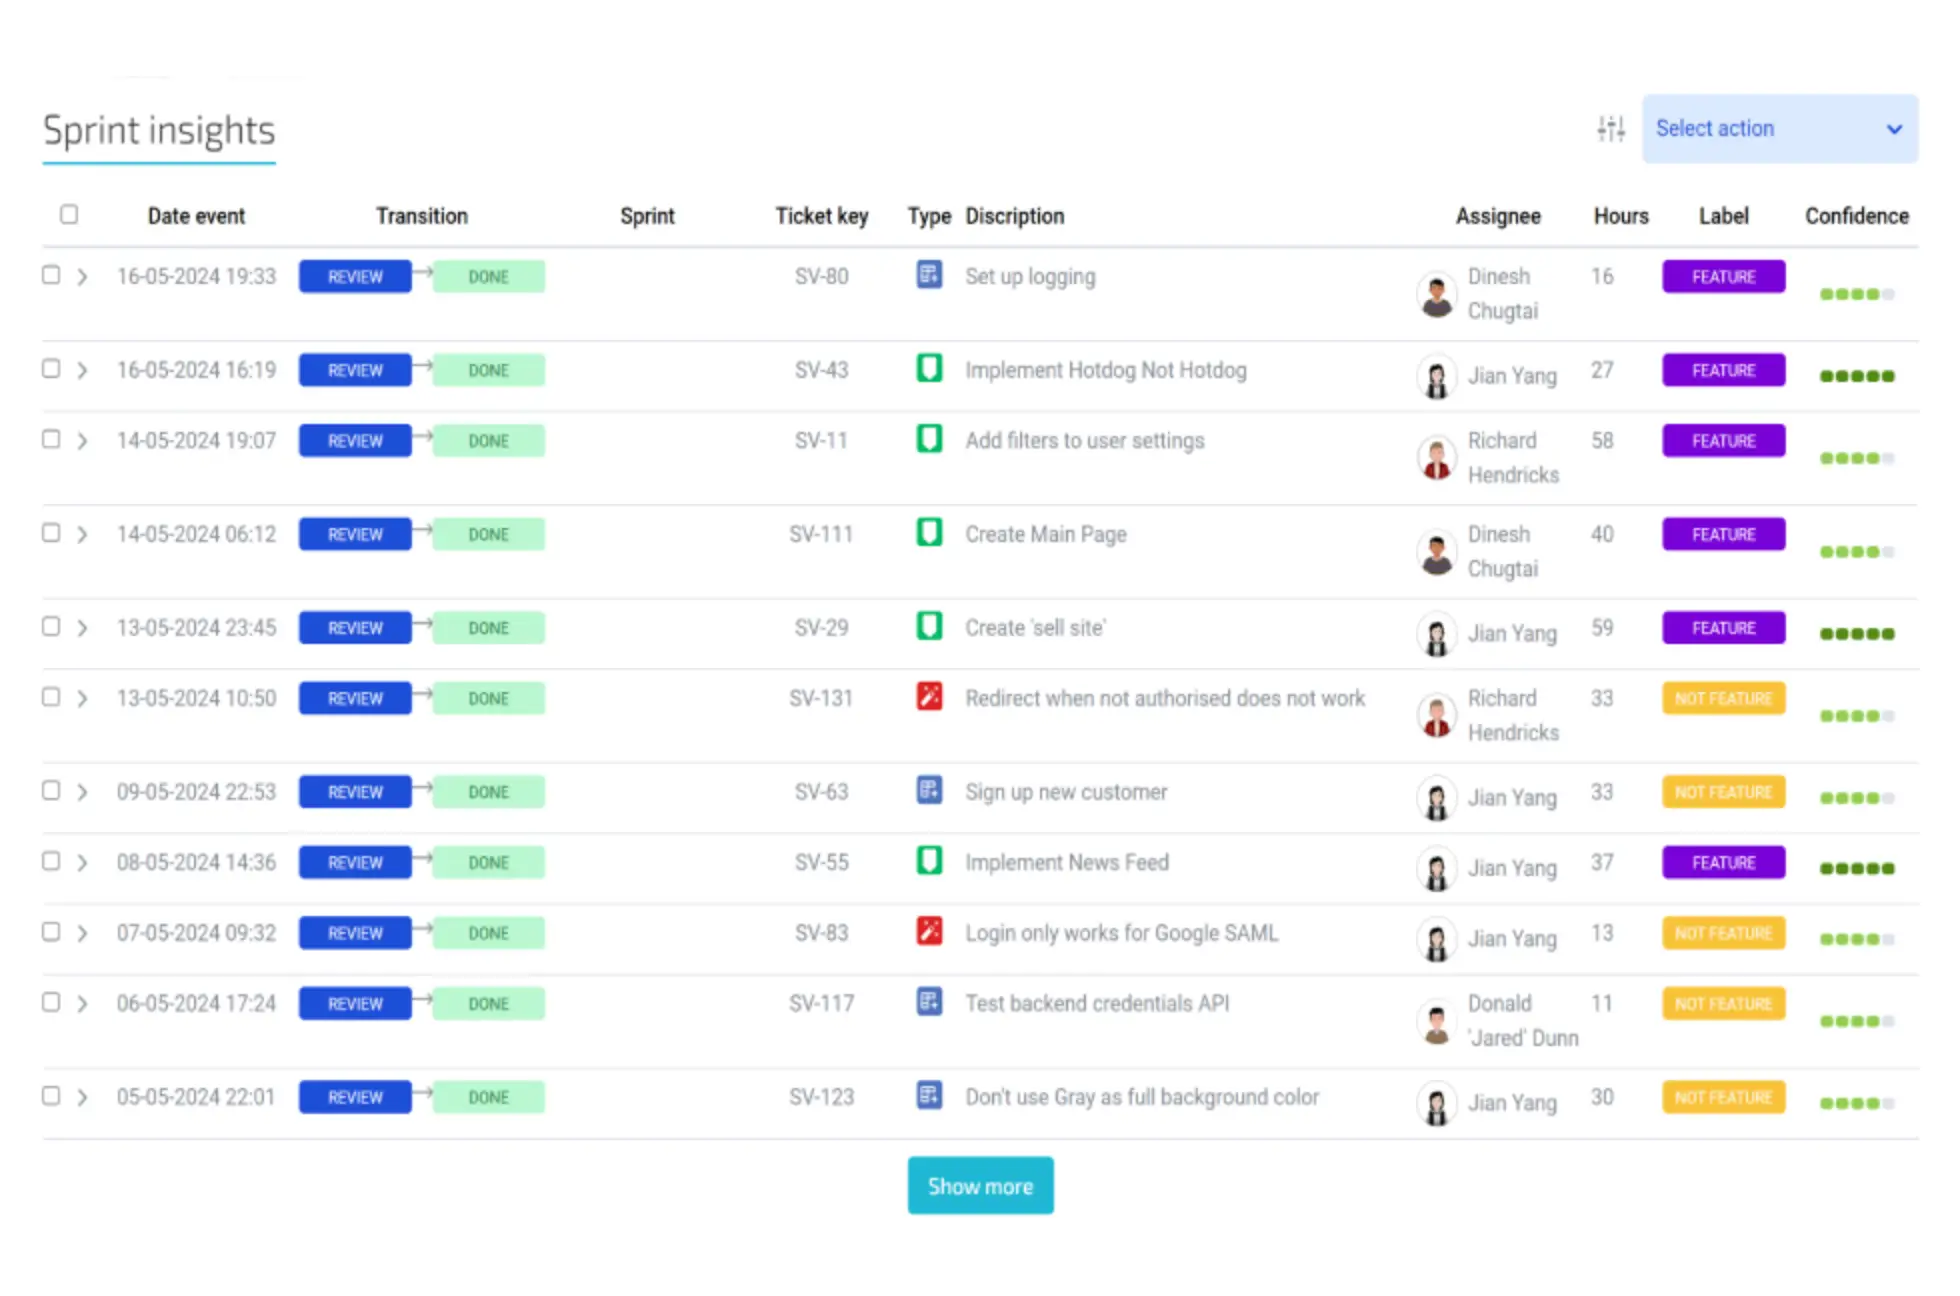
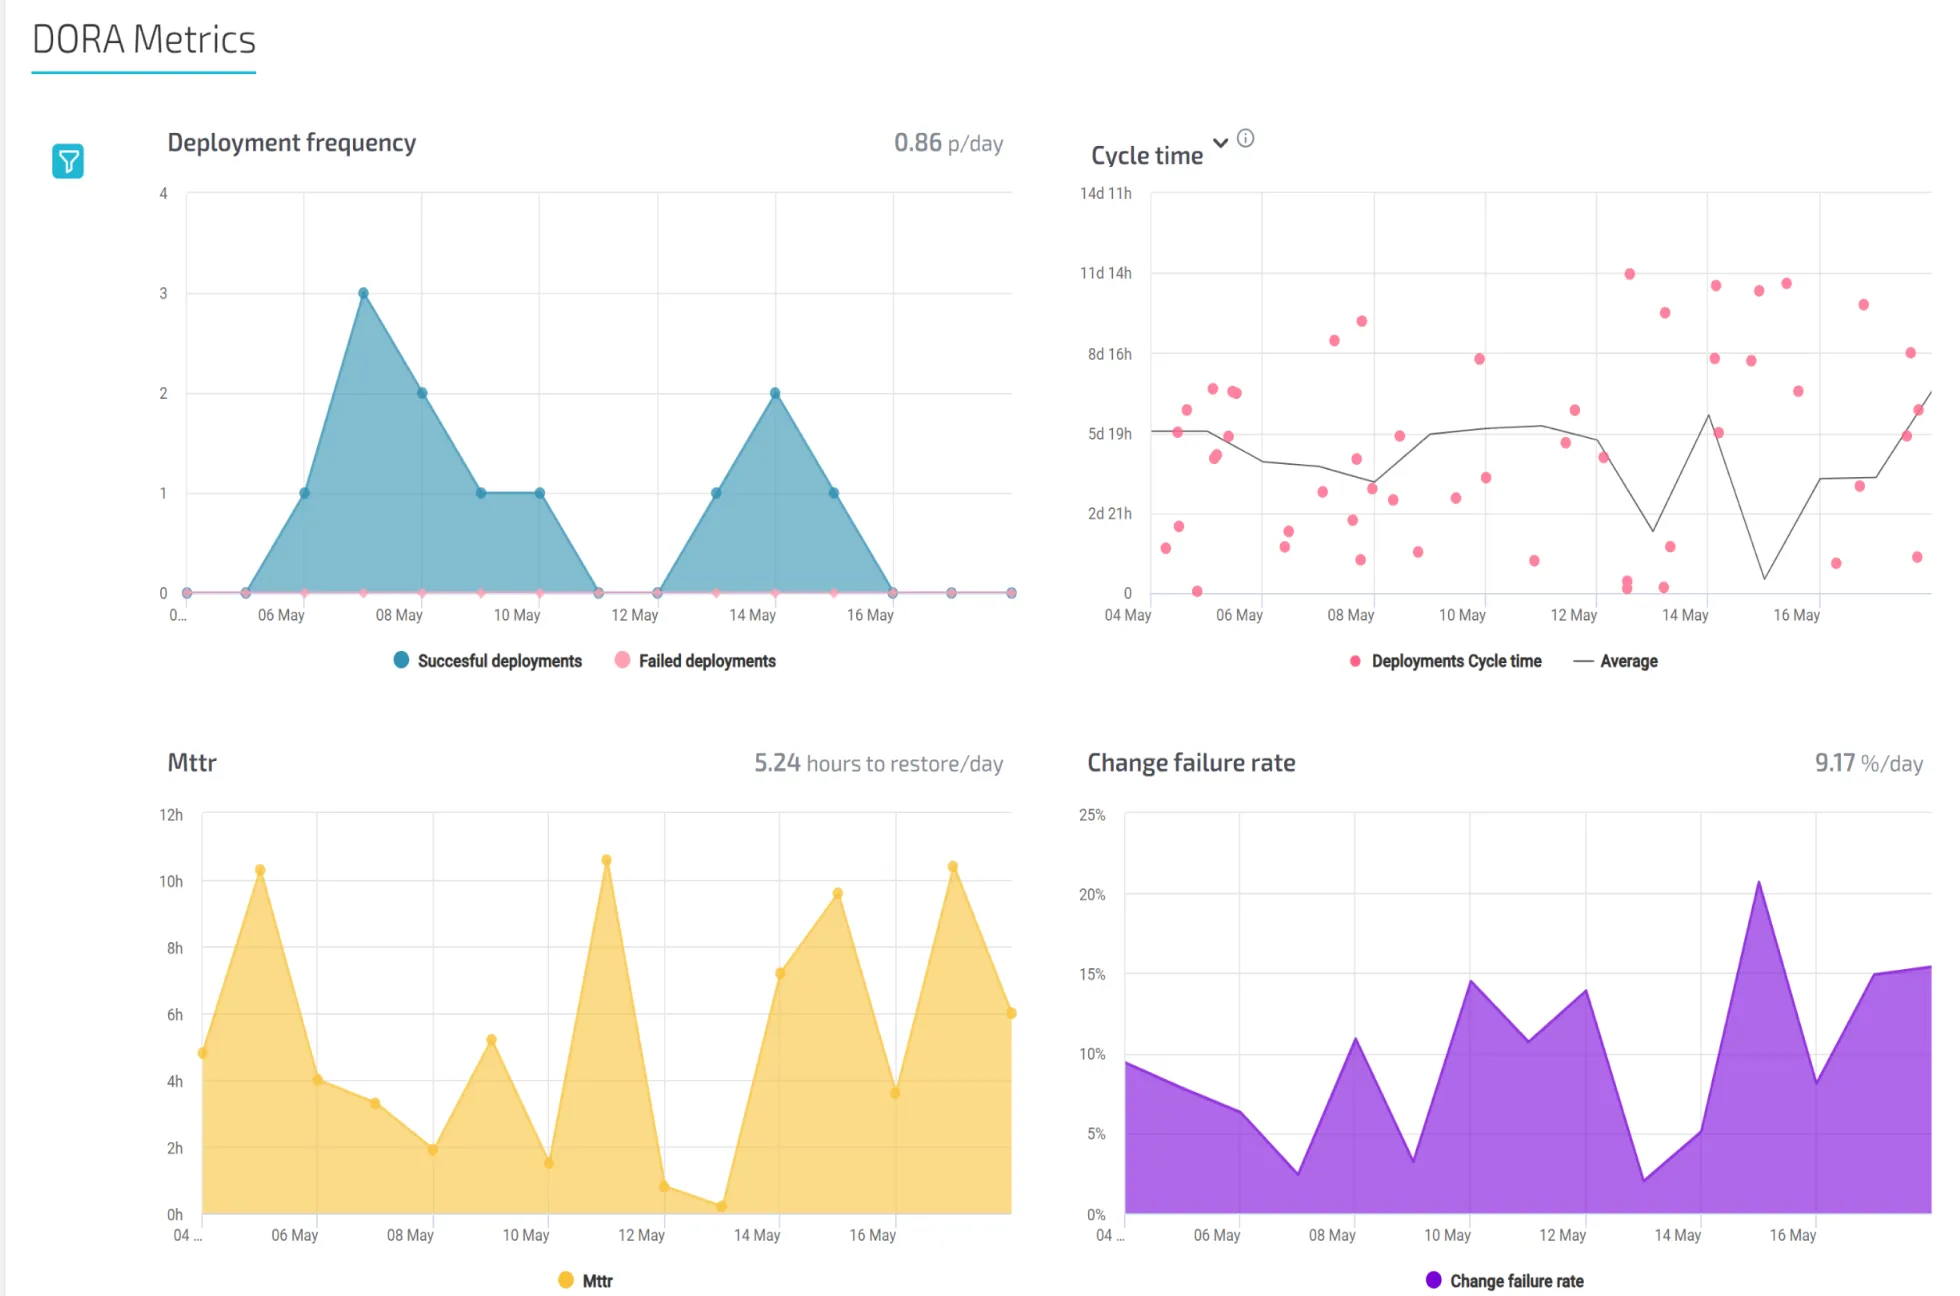
Deployment frequency, lead time for changes, change failure rate and time to restore, read automatically from Git, CI/CD and your incident tooling. DORA's own 2025 report found AI adoption raises throughput and delivery instability together; the four metrics side by side are how a team sees both halves of that trade at once.
Clear and fair performance data. Agile Analytics measures Deployment Frequency, Lead Time for Changes, Mean Time to Recovery (MTTR) and Change Failure Rate (CFR) - 4 pillars of DevOps Research and Assessment.
Data-Driven Decision Support. Agile Analytics is your reliable data-driven decision assistant that automatically tracks and continuously updates DORA metrics. Say goodbye to manual data collection and report generation – Agile Analytics handles everything for you.
Link DevOps metrics to other performance measurements. Agile Analytics integrates data from your CI/CD environment into the central system to provide insights into DORA metrics and links to service health and project management, giving an actual overview.
Kudos
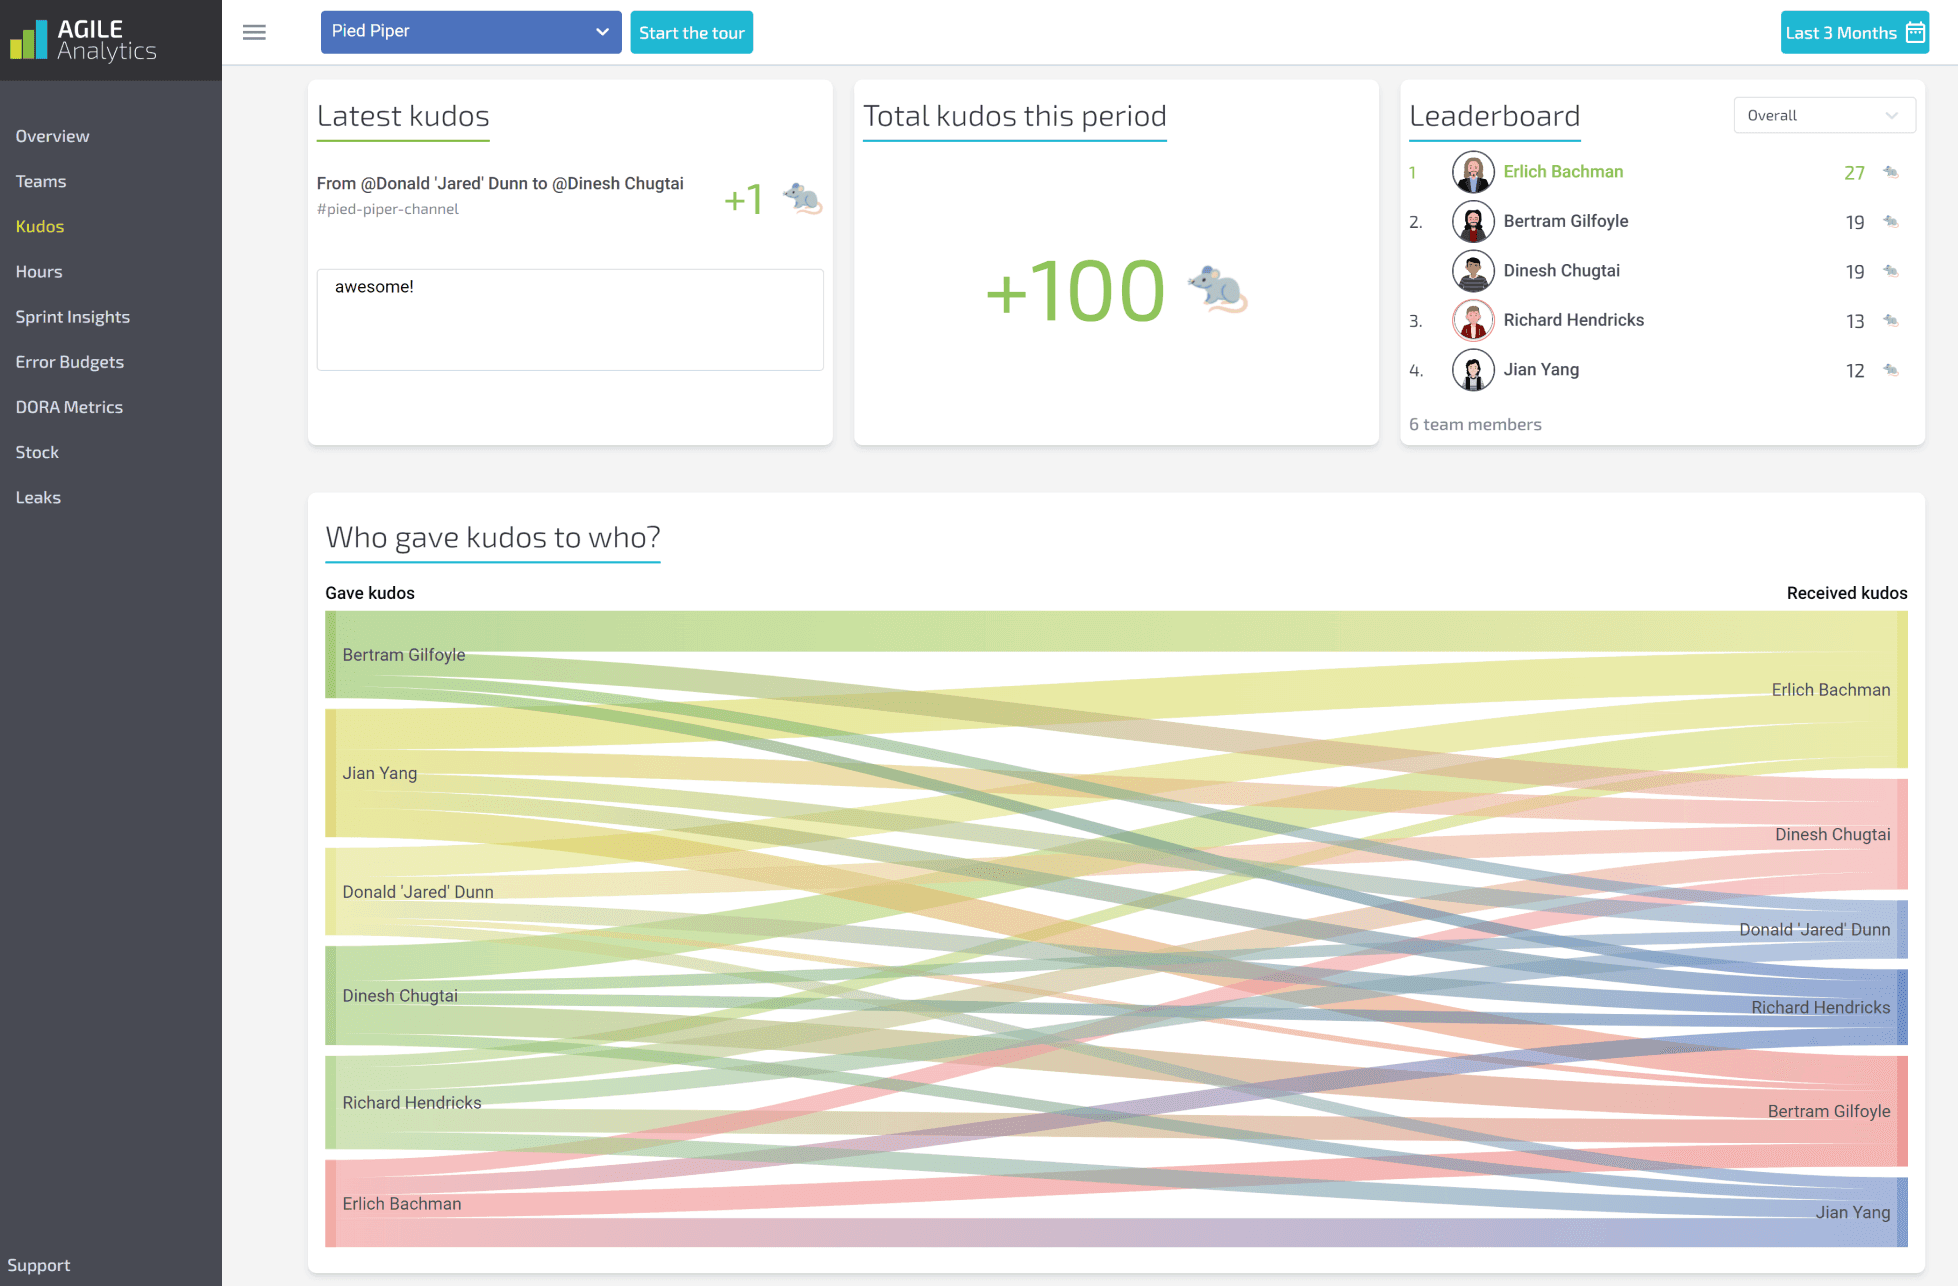
Celebrate success. Agile Analytics provides intuitive leaderboards that make it effortless to identify the top performers in your team. By measuring the kudos given on popular communication platforms like Slack, Discord, or Microsoft Teams, you can quickly see who is leading the charts and who is being celebrated.
Create a Safe and Fun Atmosphere. By acknowledging achievements on Slack with unique emojis (⭐ , 👍 , 🌮 ) and relevant hashtags, team members feel appreciated and inspired to continue striving for excellence. This practice reinforces a positive team culture and encourages continuous improvement.
Easy integration. Adding an Agile Analytics bot to your Slack Workspace is as easy as pie.
Seamless Integrations for Agile Success
Grafana Integration
Easily visualize key Agile metrics like DORA and SLOs with our Grafana integration. Customize dashboards, monitor real-time performance, and make data-driven decisions to improve team efficiency.
Backstage.io Integration
Seamlessly connect Agile Analytics with Backstage.io to centralize development tools, services, and insights. Access actionable performance data directly within your developer portal to streamline workflows and enhance collaboration.

Try it out for free
Experience full access to Agile Analytics with our 60 days free trial. Including assistance in onboarding. No creditcard required.