Real-Life Examples of Service Level Objectives (SLOs)

Published on 13 June 2025 by Zoia Baletska
Service Level Objectives (SLOs) aren’t just for massive cloud providers or SRE teams at Google. They’re highly relevant for any modern software development team that wants to improve reliability, performance, and customer experience, without burning out developers.
In this article, we’ll examine real-world, actionable SLO examples used by actual engineering teams – from frontend to backend, APIs to CI/CD. These examples show how to turn vague reliability goals into measurable commitments.

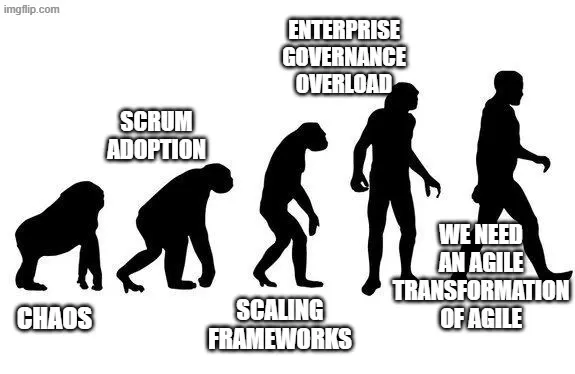
SLOs in Agile Analytics
1. Frontend / Web App Team
Why these SLOs? Frontend performance directly impacts user satisfaction and business outcomes. Metrics like page load times and conversion-critical flows (logins, sign-ups) are chosen because they reflect the real experience of end users. These SLOs help keep UX fast and frictionless.
🧪 Page Load Times
-
99% of homepage loads complete in under 2 seconds for users on a fast network, measured over a 7-day rolling window.
-
95% of route changes on SPA are complete in under 500ms.
🎯 Core User Journeys
-
98% of logins succeed on the first attempt within 3 seconds.
-
99.5% of user sign-ups complete without error.
2. Backend / API Team
Why these SLOs? APIs are the backbone of most modern apps. Teams focus on low latency, low error rates, and stability during retries. These SLOs are chosen because they impact both frontend users and internal dependencies across microservices.
⚙️ Request Latency
-
99% of POST /api/checkout calls complete within 300ms over 30 days.
-
95% of internal service-to-service calls respond in under 100ms.
❌ Error Rate
-
<0.1% of total requests return 5xx errors, excluding deployments.
-
No more than 1% of requests to /api/payments fail per week.
🔁 Retry Behavior
- 99.9% of retryable failures are resolved within 3 retries.
3. Database / Storage Team
Why these SLOs? For data-heavy applications, availability and consistency are non-negotiable. These SLOs ensure the database team maintains speed and correctness under load while minimising risks in backup and recovery.
🔒 Data Consistency & Availability
-
100% of writes to the billing database are acknowledged within 100ms.
-
99.99% of read requests to the customer profile table succeed without stale data.
💾 Backup SLO
- All production data is backed up every 6 hours, with recovery success >99.9% verified monthly.
4. DevOps / CI/CD / Platform Team
Why these SLOs? CI/CD stability is critical to developer productivity and deployment velocity. These metrics help platform teams ensure high availability and fast recovery, while maintaining low rollback rates and efficient build cycles.
🚀 Deployment Reliability
-
<1% of production deployments trigger a rollback.
-
95% of CI/CD pipelines complete successfully on the first try.
🧯 Incident Response
-
Mean Time to Recovery (MTTR) for Sev-1 incidents stays under 30 minutes.
-
Alerts are acknowledged within 5 minutes 99% of the time during business hours.
📦 Build Times
-
95% of builds complete in under 10 minutes.
-
90% of staging deployments finish within 15 minutes of commit.
5. Mobile / Cross-Platform Teams
Why these SLOs? Mobile users are especially sensitive to crashes and launch delays. These SLOs aim to provide a stable, responsive experience across platforms by tracking crash rates and performance on real devices.
📱 Crash-Free Sessions
-
Crash-free rate of >99.5% on iOS and Android apps, measured weekly.
-
App launch time under 2 seconds for 95% of users.
6. QA / Testing Automation
Why these SLOs? Automated tests must be fast and reliable to support continuous delivery. These SLOs highlight how test flakiness and long runtimes impact confidence in the release process and slow down development.
⏱️ Test Reliability
-
98% of end-to-end test suites pass on the main branch within 20 minutes.
-
90% of flaky tests are triaged within 2 days of detection.
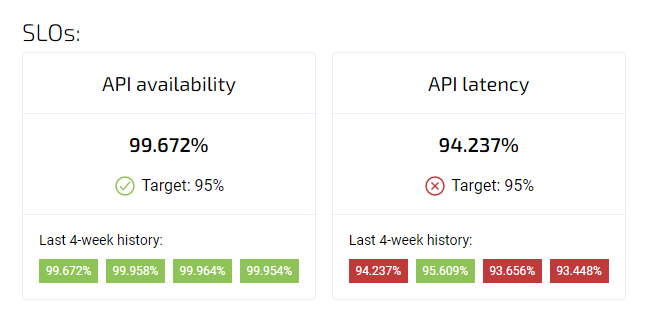
Tracking Availability SLO in Agile Analytics
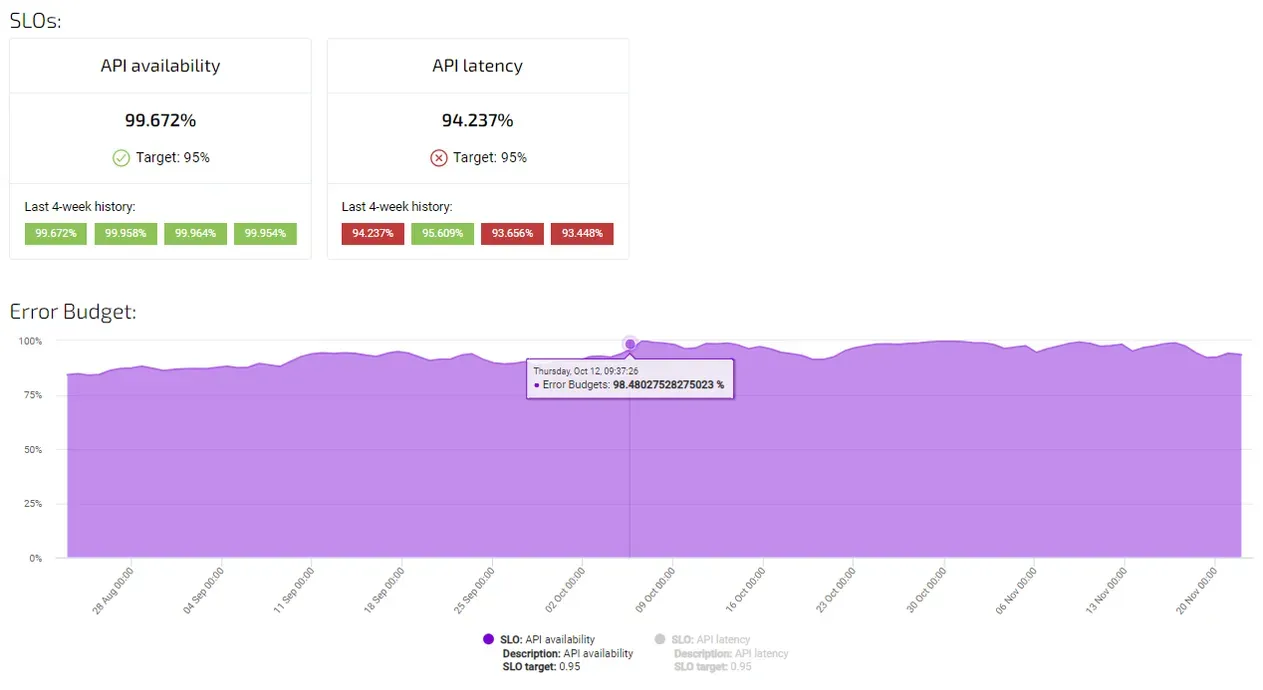
tracking availability SLO in Agile Analytics
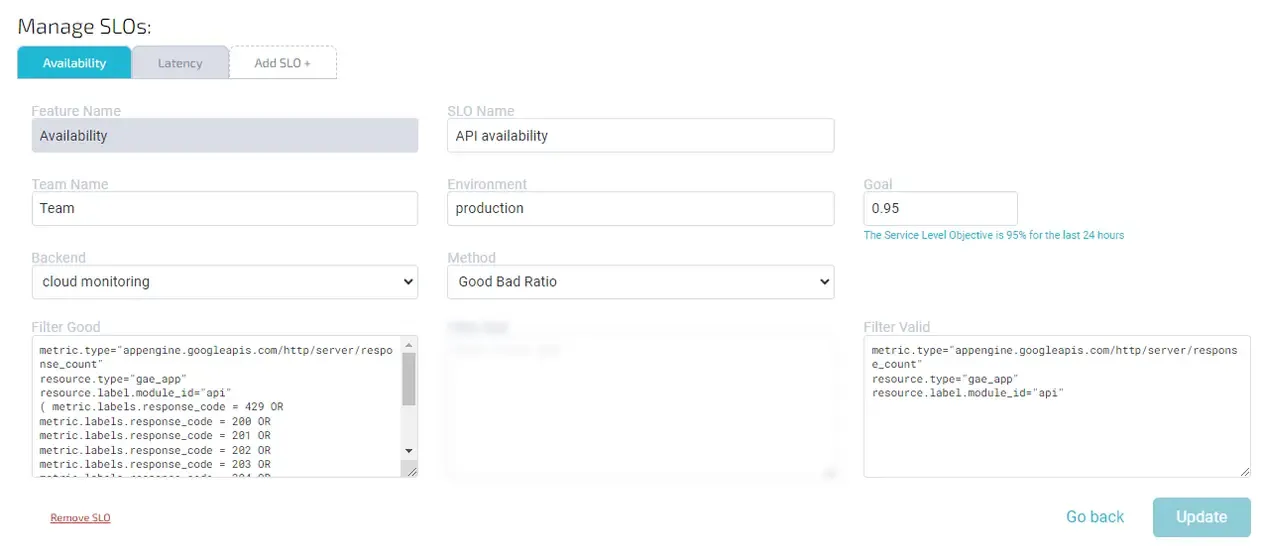
Common filters to measure availability (good-bad ratio):
Filter good:
1 2 3 4 5 6 7 8 9 10 11 12 13 14 15 16project="google-project-name" metric.type="appengine.googleapis.com/http/server/response_count" resource.type="gae_app" resource.label.module_id="module-name" (metric.labels.response_code = 429 OR metric.labels.response_code = 200 OR metric.labels.response_code = 201 OR metric.labels.response_code = 202 OR metric.labels.response_code = 203 OR metric.labels.response_code = 204 OR metric.labels.response_code = 205 OR metric.labels.response_code = 206 OR metric.labels.response_code = 207 OR metric.labels.response_code = 208 OR metric.labels.response_code = 226 OR metric.labels.response_code = 304)
Filter valid:
1 2 3 4project="google-project-name" metric.type="appengine.googleapis.com/http/server/response_count" resource.type="gae_app" resource.label.module_id="module-name"
Setting up a Latency SLO in Agile Analytics
Here is a common Latency SLO (Distribution cut) setup in Agile Analytics:
tracking latency SLO in Agile Analytics
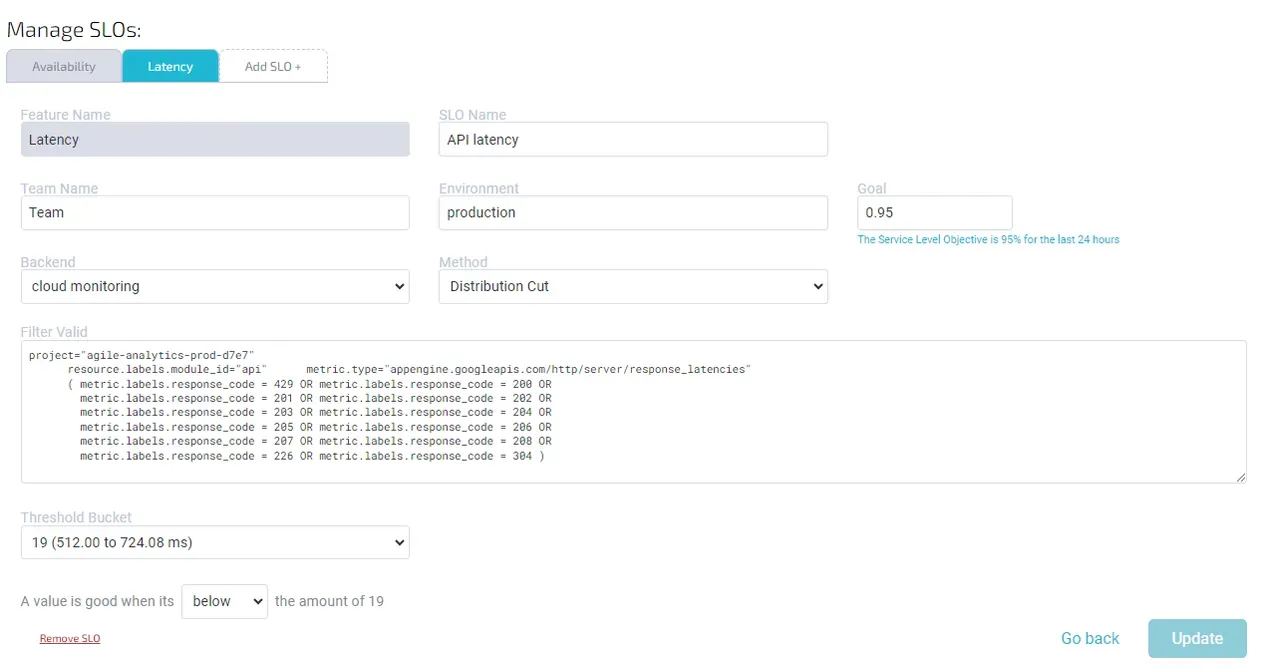
Filter valid:
1 2 3 4 5 6 7 8 9 10 11 12 13 14 15project="google-project-name" resource.labels.module_id="module-name" metric.type="appengine.googleapis.com/http/server/response_latencies" (metric.labels.response_code = 429 OR metric.labels.response_code = 200 OR metric.labels.response_code = 201 OR metric.labels.response_code = 202 OR metric.labels.response_code = 203 OR metric.labels.response_code = 204 OR metric.labels.response_code = 205 OR metric.labels.response_code = 206 OR metric.labels.response_code = 207 OR metric.labels.response_code = 208 OR metric.labels.response_code = 226 OR metric.labels.response_code = 304)
Threshold bucket: 19 Good Below Threshold: True
Conclusion
SLOs don’t need to be perfect – they need to be useful. Start with one or two critical services or user flows. Make the SLOs visible to your team. Review them monthly. Use them to guide conversations between engineering, product, and ops.
The best-performing teams don’t treat SLOs as a burden – they treat them as a tool for focus, clarity, and quality.
Want to monitor your SLOs alongside DORA metrics like Lead Time and Change Failure Rate? Try Agile Analytics to track what matters in your delivery pipeline.
Implement Service Level Objectives
Set up Service Level Objectives using best practices and easy-to-use dashboards. Be up and running in no-time with Agile Analytics.