Developer Experience & Long-Term Health: Measuring AI Adoption's Impact on Burnout and Skill Growth

Published on 22 January 2026 by Zoia Baletska

In the first article of this series, we explored Layer 1: AI adoption & tool usage — answering a foundational question: are developers actually using AI tools, and how deeply? In Layer 2, we moved downstream to output metrics, examining how to measure PR throughput, cycle time, quality, and rework without falling into misleading productivity traps.
Together, these layers help explain what is happening in AI-assisted development.
But they still miss a critical dimension.
AI tools don’t just change how code is written — they change how developers think, learn, and experience their work. And those effects rarely show up in PR metrics or dashboards until it’s too late.
That’s where Layer 3 comes in.
This article focuses on Developer Experience (DevEx) and long-term team health — measuring whether AI adoption is sustainable over time, or quietly increasing burnout, cognitive load, and skill erosion beneath the surface.
Why output metrics are not enough
Layer 2 metrics answer: “Are we shipping faster and with acceptable quality?”
Layer 3 asks harder questions:
-
Are developers more or less satisfied?
-
Is AI reducing toil — or adding mental overhead?
-
Are engineers learning faster, or outsourcing thinking?
-
Will this team still perform in 12–24 months?
These questions matter because burnout, disengagement, and skill erosion are delayed costs. By the time they appear in attrition numbers, it’s already expensive to fix them.
Core DevEx dimensions to measure
1. Developer Experience Index (DXI)
DXI is a composite metric that captures how developers experience their daily work. It typically combines multiple survey dimensions into a single trendable signal.
Common DXI components include:
-
Flow and focus time
-
Tooling friction
-
Perceived productivity
-
Autonomy and control
-
Satisfaction with code quality
Why DXI matters for AI:
AI can improve perceived speed while harming clarity, confidence, or ownership. DXI helps detect these trade-offs early.
2. Cognitive Load & Mental Overhead
AI changes how developers think — not just how they code.
Signals to track:
-
Frequency of context switching
-
Time spent reviewing AI-generated code
-
“Explainability” friction (understanding why code works)
-
Self-reported mental fatigue
High AI usage combined with rising cognitive load often explains why experienced developers sometimes slow down instead of speeding up.
3. Burnout & Sustainability Indicators
Burnout rarely appears suddenly. It accumulates.
Track trends in:
-
Emotional exhaustion
-
Sense of control over work
-
After-hours work patterns
-
Recovery time between sprints
-
Survey responses related to stress and pressure
AI can reduce repetitive work — but it can also raise expectations and throughput pressure, accelerating burnout if left unchecked.
4. Skill Growth & Learning Curve
One of the most controversial questions in AI-assisted development is whether developers are learning faster or delegating thinking away.
Measure skill growth through:
-
Self-assessed learning progress
-
Confidence working without AI assistance
-
Breadth of tasks developers feel comfortable owning
-
Onboarding speed for new technologies
Healthy AI adoption should compress learning curves, not flatten skill development.
5. Retention, Engagement & Trust Signals
Long-term health eventually shows up in retention — but you shouldn’t wait for resignations.
Early indicators include:
-
Declining engagement scores
-
Reduced participation in design discussions
-
Lower ownership of complex features
-
Correlation between AI usage patterns and satisfaction
Notably, teams with forced or opaque AI adoption often show worse DevEx than teams where AI use is optional and transparent.
How to measure DevEx without survey fatigue
Use short, recurring pulse surveys
-
5–8 questions
-
Quarterly cadence
-
Stable questions for trend analysis
Combine qualitative and quantitative signals
-
Pair survey trends with usage and output metrics
-
Look for correlations, not single-point answers
Segment carefully
Compare:
-
Heavy vs light AI users
-
New hires vs experienced engineers
-
Different teams or domains
-
Patterns matter more than averages.
Interpreting DevEx signals responsibly
DevEx metrics should never be used for:
-
Individual performance evaluation
-
Ranking developers
-
Enforcing AI usage
Instead, they should support:
-
Tooling decisions
-
Process improvements
-
Expectation management
-
Sustainable delivery planning
When DevEx metrics decline while output metrics rise, you’re likely seeing short-term gains at long-term cost.
How does this layer complete the AI impact picture
Together, the three layers answer different but connected questions:
Layer
Adoption & Usage
Output & Quality
DevEx & Health
What does it tell you
Is AI actually used, and how?
Does AI improve delivery safely?
Is AI sustainable for people?
Skipping Layer 3 often leads to quiet failure — where teams ship more today but lose capability tomorrow.
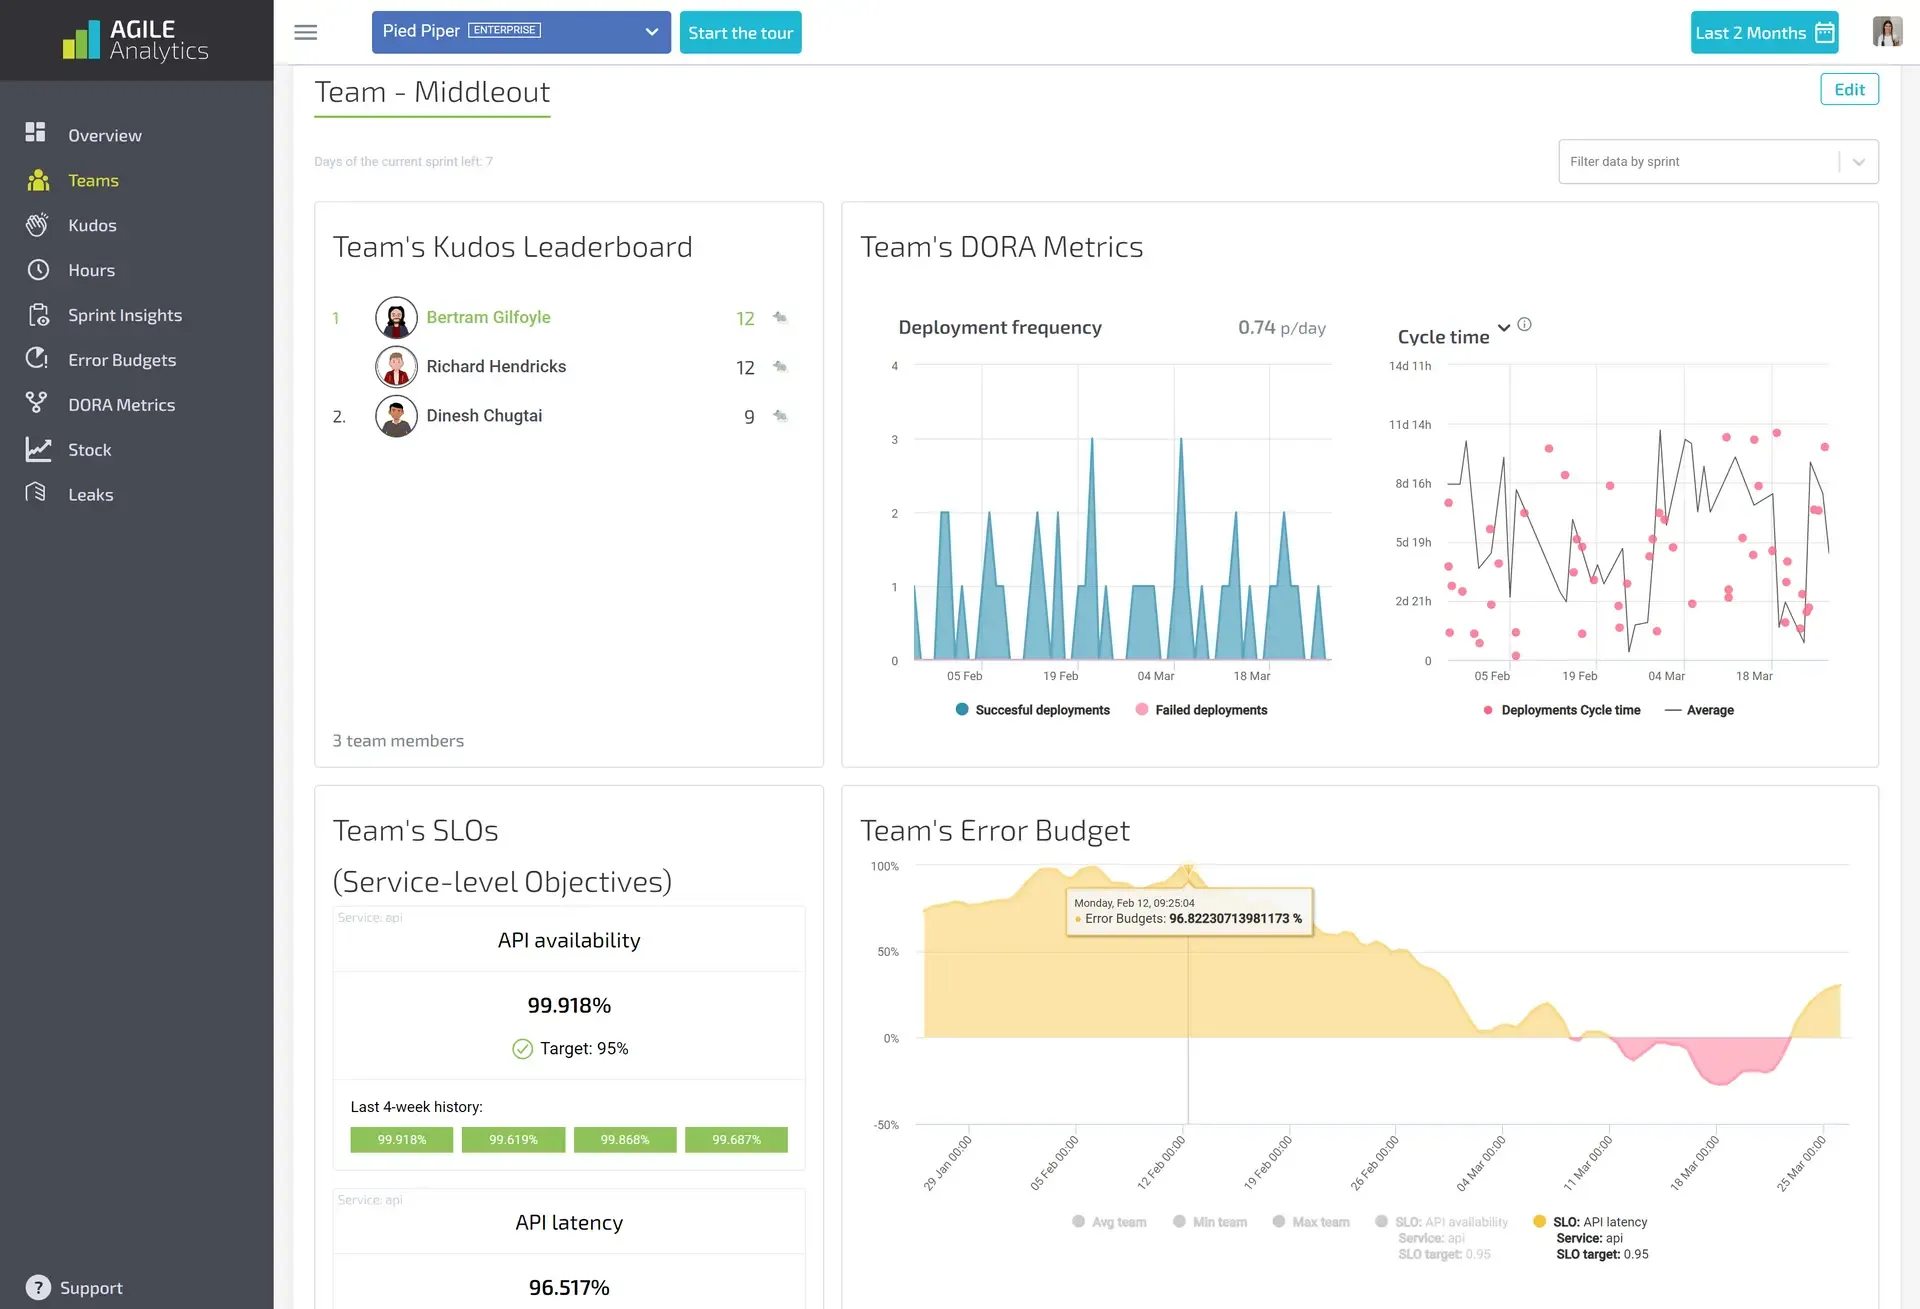
Where Agile Analytics fits
At Agile Analytics, we connect delivery metrics, AI usage signals, and developer feedback into a single, coherent view.
This makes it possible to:
-
Detect early burnout risks
-
Understand AI’s impact beyond speed
-
Balance productivity with sustainability
-
Make evidence-based decisions about AI tooling
AI should make teams stronger — not just faster.
What’s next in the series
Next, we’ll look at real-world case studies — where AI impact measurement succeeded, failed, or produced unexpected results. We’ll unpack what actually worked, what didn’t, and why.
Supercharge your Software Delivery!
Implement DevOps with Agile Analytics
Implement Site Reliability with Agile Analytics
Implement Service Level Objectives with Agile Analytics
Implement DORA Metrics with Agile Analytics