Putting It All Together — How to Build an AI Impact Dashboard Without Breaking Trust or Teams

Published on 5 February 2026 by Zoia Baletska
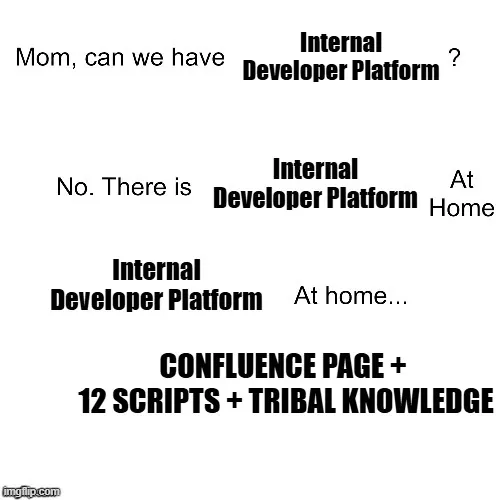
By now, most software organisations have accepted a simple truth: AI is everywhere in development — whether leadership tracks it or not. What’s still missing in 2025 is not tooling, but coherence.
In the earlier parts of this series, we deliberately broke AI impact into layers:
-
Layer 1 focused on inputs: who is using AI, how often, and in what ways
-
Layer 2 examined outputs: throughput, quality, and how code changes when AI is involved
-
Layer 3 zoomed out to human impact: developer experience, cognitive load, burnout, and long-term learning
Layer 4 is where these threads finally meet.
This is the point where organisations stop asking “Can we measure AI?” and start asking “Are we measuring the right things — and for the right reasons?”
Why Most AI Dashboards Fail Before They Launch
The failure mode is almost always the same.
A team connects AI tool telemetry, pulls a few engineering metrics, adds a satisfaction survey, and ships a dashboard. On paper, it looks impressive. In practice, it creates anxiety, misinterpretation, or quiet resistance.
Why?
Because dashboards don’t fail due to a lack of data. They fail due to a lack of intent.
If your organisation hasn’t answered why it wants to measure AI impact, the dashboard will eventually be used as:
-
a proxy performance tool,
-
a justification for tooling spend,
-
or a subtle surveillance mechanism.
Developers sense this immediately, which is exactly the problem highlighted in Layer 3. The moment people feel observed rather than supported, the metrics stop reflecting reality.
An AI Impact Dashboard must be designed as a learning system, not a control system.
From Metrics to Meaning: What You Should Actually Measure
A common misconception is that an AI dashboard needs to be comprehensive. In reality, it needs to be selective. The data you collect should answer specific organisational questions:
-
Is AI helping us deliver value more reliably?
-
Is quality improving or eroding over time?
-
Is developer cognitive load decreasing or simply shifting?
-
Are we trading short-term speed for long-term fragility?
This is where the earlier layers become essential context.
From Layer 1, adoption metrics tell you whether AI is even present in daily work — but not whether it helps.
From Layer 2, output metrics show changes in throughput and quality — but not whether those changes are sustainable.
From Layer 3, experience metrics reveal how AI feels to developers — but not whether the organisation is learning.
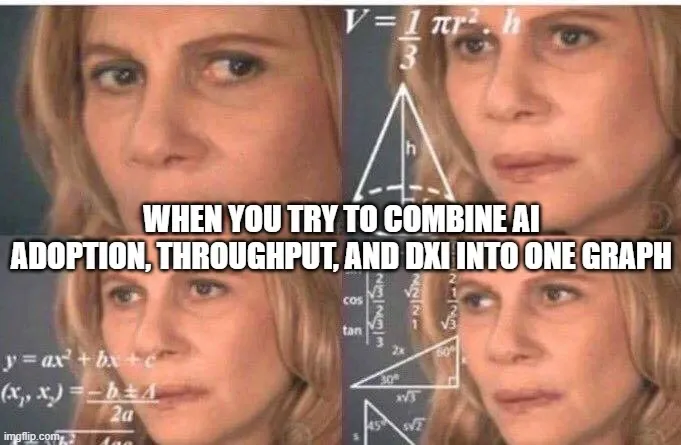
Layer 4 connects these signals into a single narrative.
Privacy Is Not a Feature — It’s the Foundation
If there’s one non-negotiable lesson from real-world AI measurement attempts, it’s this: You cannot bolt privacy on later. Teams that start with individual-level tracking — even with good intentions — eventually lose trust. And once trust is gone, the dashboard becomes theatre. A responsible AI Impact Dashboard treats anonymisation as a design principle, not a compliance checkbox.
That means:
-
Measuring at the team or cohort level
-
Aggregating data over time instead of exposing snapshots
-
Avoiding raw prompt storage entirely
-
Separating analytics from performance evaluation systems
This aligns directly with the findings discussed in Layer 3: perceived surveillance alone increases cognitive load and decreases experimentation — even when no one is actively “watching.”
If your dashboard changes how developers behave, it’s already broken.
How the Data Comes Together in Practice
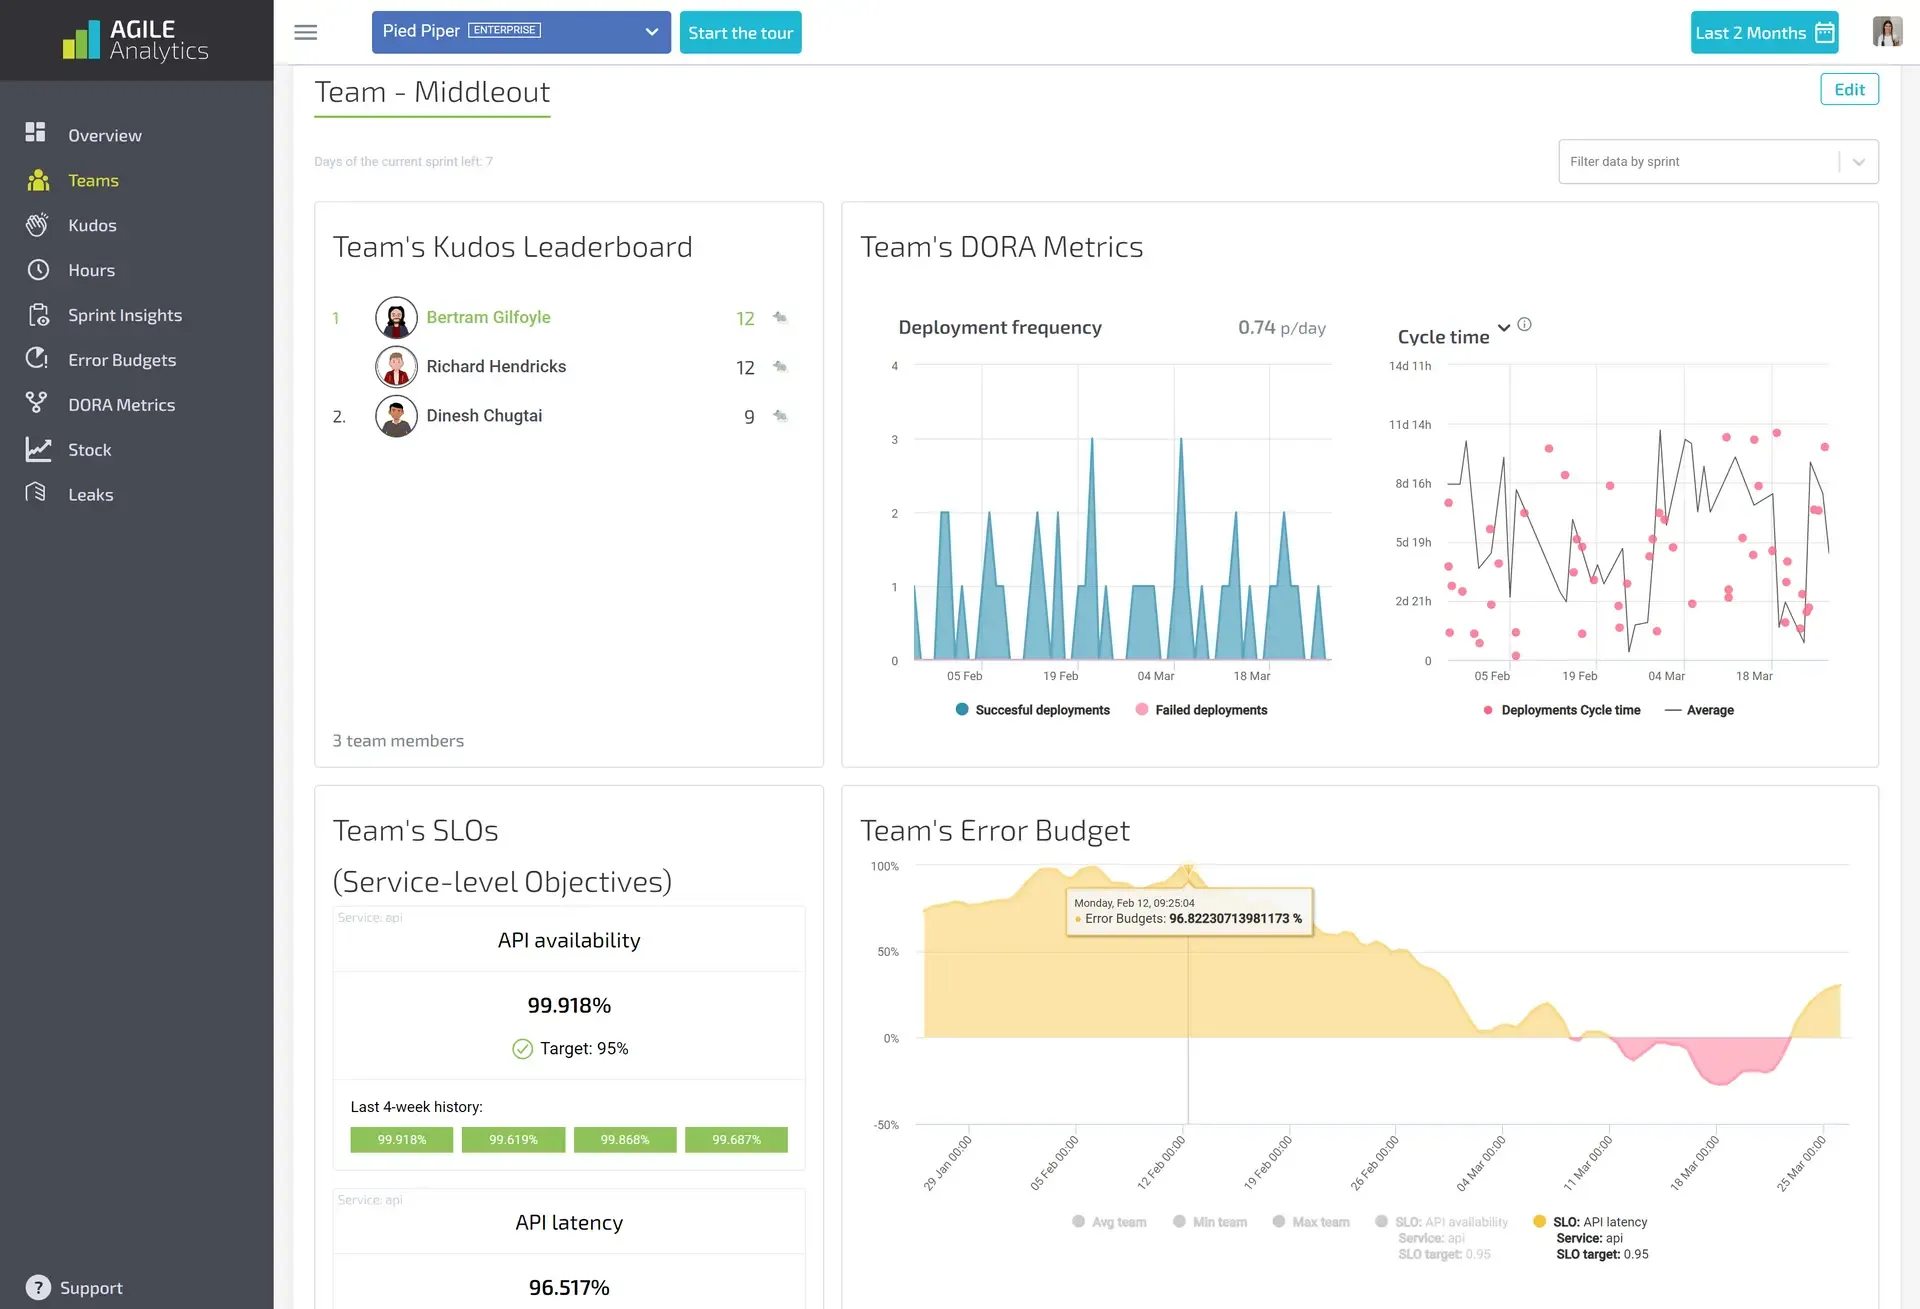
Technically, most AI Impact Dashboards look similar under the hood. They combine signals from AI tools, engineering systems, and surveys. The difference isn’t where the data comes from — it’s how it’s interpreted.
AI tool telemetry can show invocation frequency, session duration, or feature usage. On its own, that’s just activity. In Layer 1, we established that usage is not impact.
Engineering metrics — PR size, cycle time, revert rate, bug density — provide output signals, but as shown in Layer 2, they must be normalised for complexity and context.
Experience data adds the missing dimension. DXI, burnout indicators, perceived learning speed — these don’t move linearly, and they often lag behind output improvements.
A meaningful dashboard doesn’t stack these metrics side by side. It connects them over time. For example:
-
Rising throughput paired with stable DXI suggests healthy acceleration
-
Rising throughput paired with declining DXI is a warning sign
-
Flat adoption but improving quality may indicate selective, mature AI usage
The dashboard’s real job is not reporting — it’s sense-making.
Designing for Different Audiences (Without Fragmenting Truth)
One of the hardest design challenges is that different stakeholders need different views — without distorting reality. Executives need high-level trends and risk signals. Engineering leaders need comparative, longitudinal insight. Teams need safe, local feedback loops.
The mistake is building three different dashboards. The better approach is building one system with layered views, all grounded in the same underlying data and governance model. This prevents what we often see in AI reporting today: leadership optimism paired with developer exhaustion — both technically “true,” yet disconnected.
Interpretation Is Where Most Damage Happens
Even a well-designed dashboard can cause harm if interpreted naively.
AI impact metrics are particularly prone to false conclusions:
-
Increased AI usage does not equal increased productivity
-
Faster delivery does not guarantee better outcomes
-
Reduced cognitive effort does not always mean deeper learning
This is why Layer 4 insists on correlation over attribution. The dashboard should surface questions, not answers. It should invite investigation, not declare success. If your dashboard feels conclusive, it’s probably misleading.
Governance: Who Protects the Dashboard from Misuse?
Every serious AI Impact Dashboard needs an owner — but not a single one. The healthiest setups we’ve seen involve shared ownership between:
-
Engineering leadership
-
Product or delivery
-
Developer experience or platform teams
Governance here isn’t about approval gates. It’s about guardrails:
-
Clear documentation on what metrics will not be used for
-
Regular reviews of metric relevance
-
Willingness to retire metrics that incentivise the wrong behaviour
Think of governance as continuous calibration — not control.
Why Layer 4 Is the Hardest (and the Most Important)
Layer 1 is easy: tools already emit signals.
Layer 2 is harder: outputs needed normalisation.
Layer 3 is uncomfortable: humans entered the equation.
Layer 4 is difficult because it forces organisations to confront intent. An AI Impact Dashboard doesn’t just measure AI. It reflects how an organisation thinks about productivity, trust, and people. Done poorly, it accelerates everything that’s already broken. Done well, it becomes a quiet advantage — guiding better decisions without drama. And that, ultimately, is the goal of Agile Analytics.
Supercharge your Software Delivery!
Implement DevOps with Agile Analytics
Implement Site Reliability with Agile Analytics
Implement Service Level Objectives with Agile Analytics
Implement DORA Metrics with Agile Analytics