Cost per Accepted Change: The Metric That Matters When AI Writes Your Code

Published on 16 September 2026 by Arjan Franzen
Switch on AI tooling in a development team and within a week every counter goes up. More commits. More pull requests. More deploys. Anyone with a dashboard sees green arrows.
None of those arrows says whether things got better. They say more is being produced, and that was never the problem. When code is cheap, a high count is no longer an achievement; it is the baseline.
The question left standing: what does it cost to get one change all the way through? Through review, through the pipeline (the automated build-and-test run every change goes through), into production, and staying there. We call that number cost per accepted change, and it is the only one that still tells us anything.
Why counts lie once AI is writing
The piece on reading DORA metrics when AI writes half your commits already said it: AI does not change your numbers, it changes what they mean. Deployment frequency (how often code reaches production) becomes noise. Lead time (from commit to running in production) drops only on the part AI does, the writing, and that was rarely the bottleneck.
What does happen: the supply of changes grows faster than the capacity to judge them. Reviewers become the constraint. And a constraint under pressure responds in one of two ways: the queue gets longer, or the review gets shallower. Neither shows up in the merge count. You see it later, in change failure rate (the share of releases that need a fix) and in revert commits.
So the count is not the point. What matters is how much of what gets produced survives the journey, and what that journey costs.
The definition
Cost per accepted change is a fraction.
Numerator: everything a change costs until it is in production. Concretely: the hours of the engineer who wrote or directed it, the hours of the reviewer(s), the CI minutes, and, recently, the model's tokens.
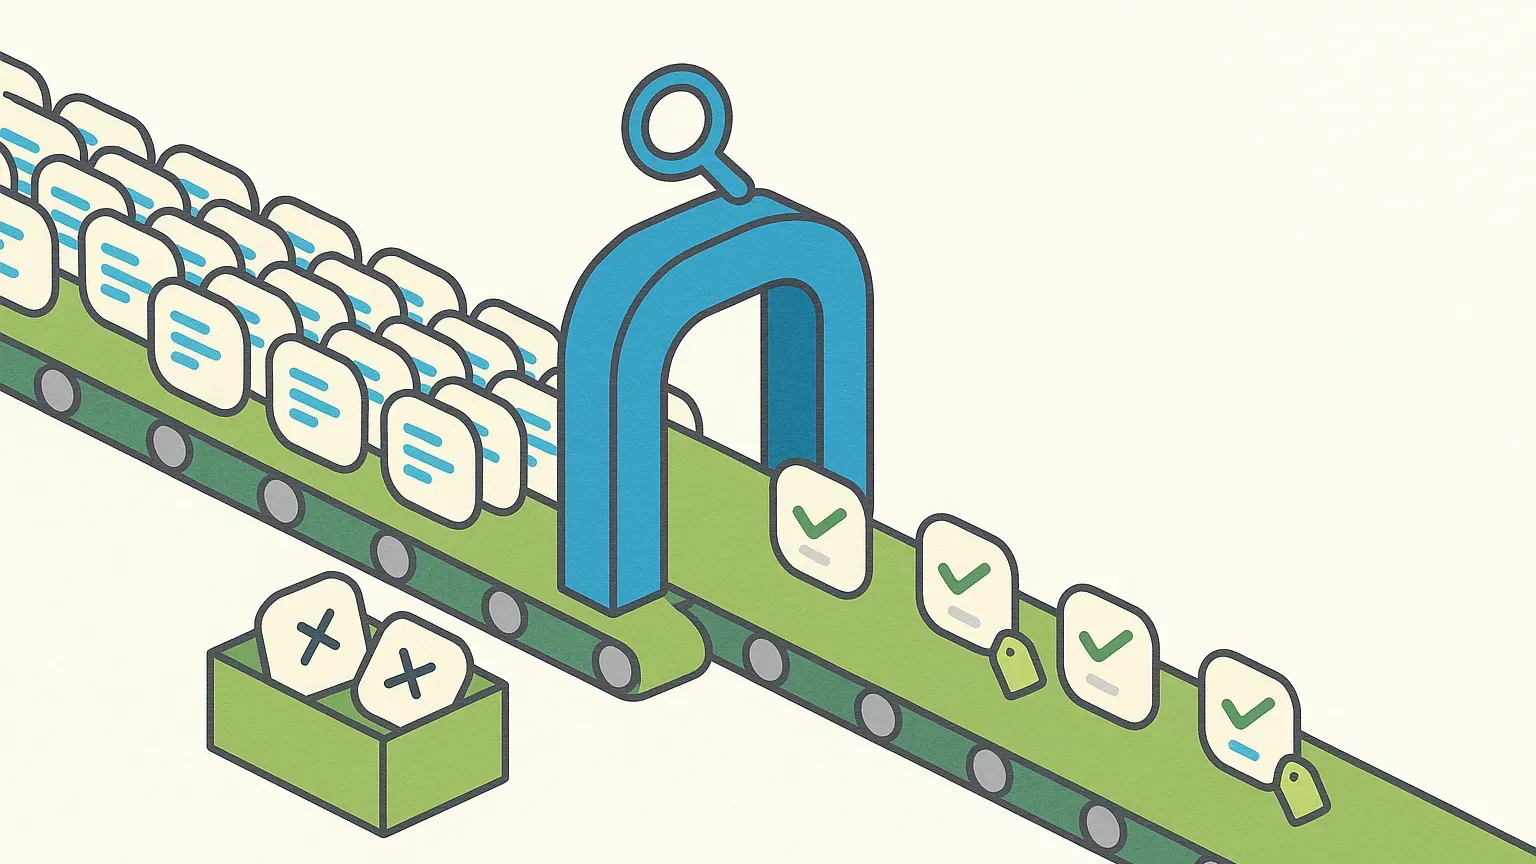
Denominator: the number of changes that were accepted. Not merged; accepted. A change counts once it is merged, deployed, and not reverted or patched by a hotfix (an emergency fix in production) within thirty days.
That last part is the core. A merge is a reviewer's opinion. Thirty days in production is a fact.
The fraction is deliberately blind to volume. Twice the PRs at the same cost per accepted change is a win. Twice the PRs at twice the cost is nothing. Twice the PRs of which half fail review is a loss that shows up as growth on every other dashboard.
What you can pull from Git and CI
You do not need to start tallying by hand. Almost all of it is already in your tools; it just has to be put side by side.
- Survival rate. Per merge: was it reverted within thirty days, or followed by a fix touching the same files? Git has that; it is change failure rate, but per change instead of per deploy.
- Review effort. Time between the first review request and approval, number of review rounds, number of comments. GitLab and GitHub expose all of it through their APIs.
- Drop-out before merge. PRs closed without merging, or open for more than a week. They cost review time and delivered nothing; they belong in the numerator, not the denominator.
- CI minutes per PR, including the repeated runs after every correction.
- Token spend per PR if you use agents. Most tooling logs it per task by now; tie it to the branch.
Hours are the hardest and the least precise. Use a fixed estimate per review round and per PR size; the error is constant and cancels out as soon as you compare.
Put those side by side and you have a number per week. That number by itself says little. Its direction, before and after a change in how you work, says everything.
The half-way threshold
One rule of thumb to start with: if fewer than half of what your agents produce survives review, you are doing the work the agent was supposed to remove.
Every rejected PR cost a reviewer time. At fifty percent drop-out, half of that time goes to work that never reaches production. That is exactly the review capacity that was already your ceiling before there was an agent.
So if review capacity is your constraint, and it is for most teams, an agent that does not bring the drop-out down makes your queue longer, not shorter. It is why the agent that reads our merge requests overnight at ZEN is not allowed to merge anything: it lowers the cost of collecting, and the cost of judging stays where it belongs.
What the number does to the conversation
The nice thing about cost per accepted change is that it moves the AI discussion from belief to measurement.
The question is no longer "does the model write good code". The question is: did the price of a change that made it go down? If so, by how much, and on which kind of work? Often you will see the number drop hard on integrations, migrations and tests and not move at all on design work. That is not a disappointment; that is the map of where to put AI.
And the number protects against the trap on the other side: a team that loosens review to clear the queue sees its merges rise and its survival rate fall. Cost per accepted change stays flat or rises, while every other dashboard turns green.
How to start
- Baseline. Four weeks of data from before the change you want to judge. Without a baseline you prove nothing afterwards.
- Define "accepted" for your team: merged, deployed, thirty days without revert or hotfix. Write it down; otherwise it drifts.
- Bring the five sources together: survival rate, review effort, drop-out before merge, CI minutes, tokens. Hours as a fixed estimate.
- Look per kind of work, not just per team. The number differs enormously between boilerplate and design.
- Track the direction, weekly. The absolute number is for the CFO; the direction is for you.
This is exactly what Agile Analytics was built for: Git, CI/CD (the automated build, test and release of every change) and Jira side by side, with DORA as the frame. Cost per accepted change is not a new metric on top; it is the same data, read from the question that matters now.
In short
AI makes code cheap. With that, every count loses its meaning: commits, PRs, deploys. What remains is the price of one change that makes it and stays. Measure it from Git and CI, define "accepted" strictly, start with a baseline, and watch the direction. If fewer than half survive review, your agent is moving the work rather than removing it.
Less guessing. More shipped software.
Measure faster — lead time, review wait and deployment frequency per team, every sprint
Guard quality — change failure rate, MTTR and Error Budgets
Prove the gain — feature work versus maintenance, from your own data
See it in 30 minutes — on your own data, not a slide deck