Cloud-Native ≠ Chaos: Using Metrics to Govern Decentralised Engineering

Published on 24 July 2025 by Zoia Baletska

Cloud-native architecture has changed how enterprises work. About 80% of businesses now implement cloud-centric infrastructure at twice the speed compared to pre-pandemic times. Companies of all sizes have made cloud computing their main platform. This change shows how organisations now think differently about their IT infrastructure.
The quick move to cloud native architecture creates new governance challenges, especially with strict compliance needs. Cloud environments' scattered nature might seem chaotic to many. The right metrics and observability tools can add structure to distributed teams. This approach keeps the cloud-native platform's speed and flexibility intact.
We created Agile Analytics to solve these challenges. Our platform finds bottlenecks and helps teams work better with useful insights. We combine data with real-life feedback from teams to track key metrics like lead time, error budgets, and SLOs. Companies that use AIOps-based analytics platforms like ours will grow tenfold by 2024. This growth shows that cloud observability needs more than basic logging and monitoring.
Understanding the Chaos Myth in Cloud-Native Teams
Cloud-native development differs from traditional software development models. Traditional models use a single application where all engineers sync their work. In spite of that, cloud-native development takes a different path. Teams own their microservices and move through development stages on their own.
Why decentralisation is often misunderstood
Leaders often hold back from decentralised engineering because of common myths. The biggest myth suggests decentralisation leads to chaos without proper structure or processes. This worry usually comes from not seeing the full picture. One of the Directors of Engineering puts it well: "as my teams grew I had less and less visibility into what was really going on"[1].
People also think decentralised systems don't work fast enough. Modern tech has substantially improved speed. Decentralised systems now match or beat centralised ones in many cases.
The difference between autonomy and anarchy
Many people get the wrong idea about autonomy in cloud-native systems. Dave Farley makes a good point: "This is tricky, because it is kind of true that you want autonomous teams and also kind of a disaster if every individual on every team has complete freedom of choice"[2].
Autonomy that works needs:
-
Well-laid-out roles with clear accountability
-
Set boundaries for team decisions
-
Team responsibility instead of personal choices
Teams should have autonomy, not individuals. Teams line up with company goals when they focus on results rather than work hours.
How metrics bring structure to distributed teams
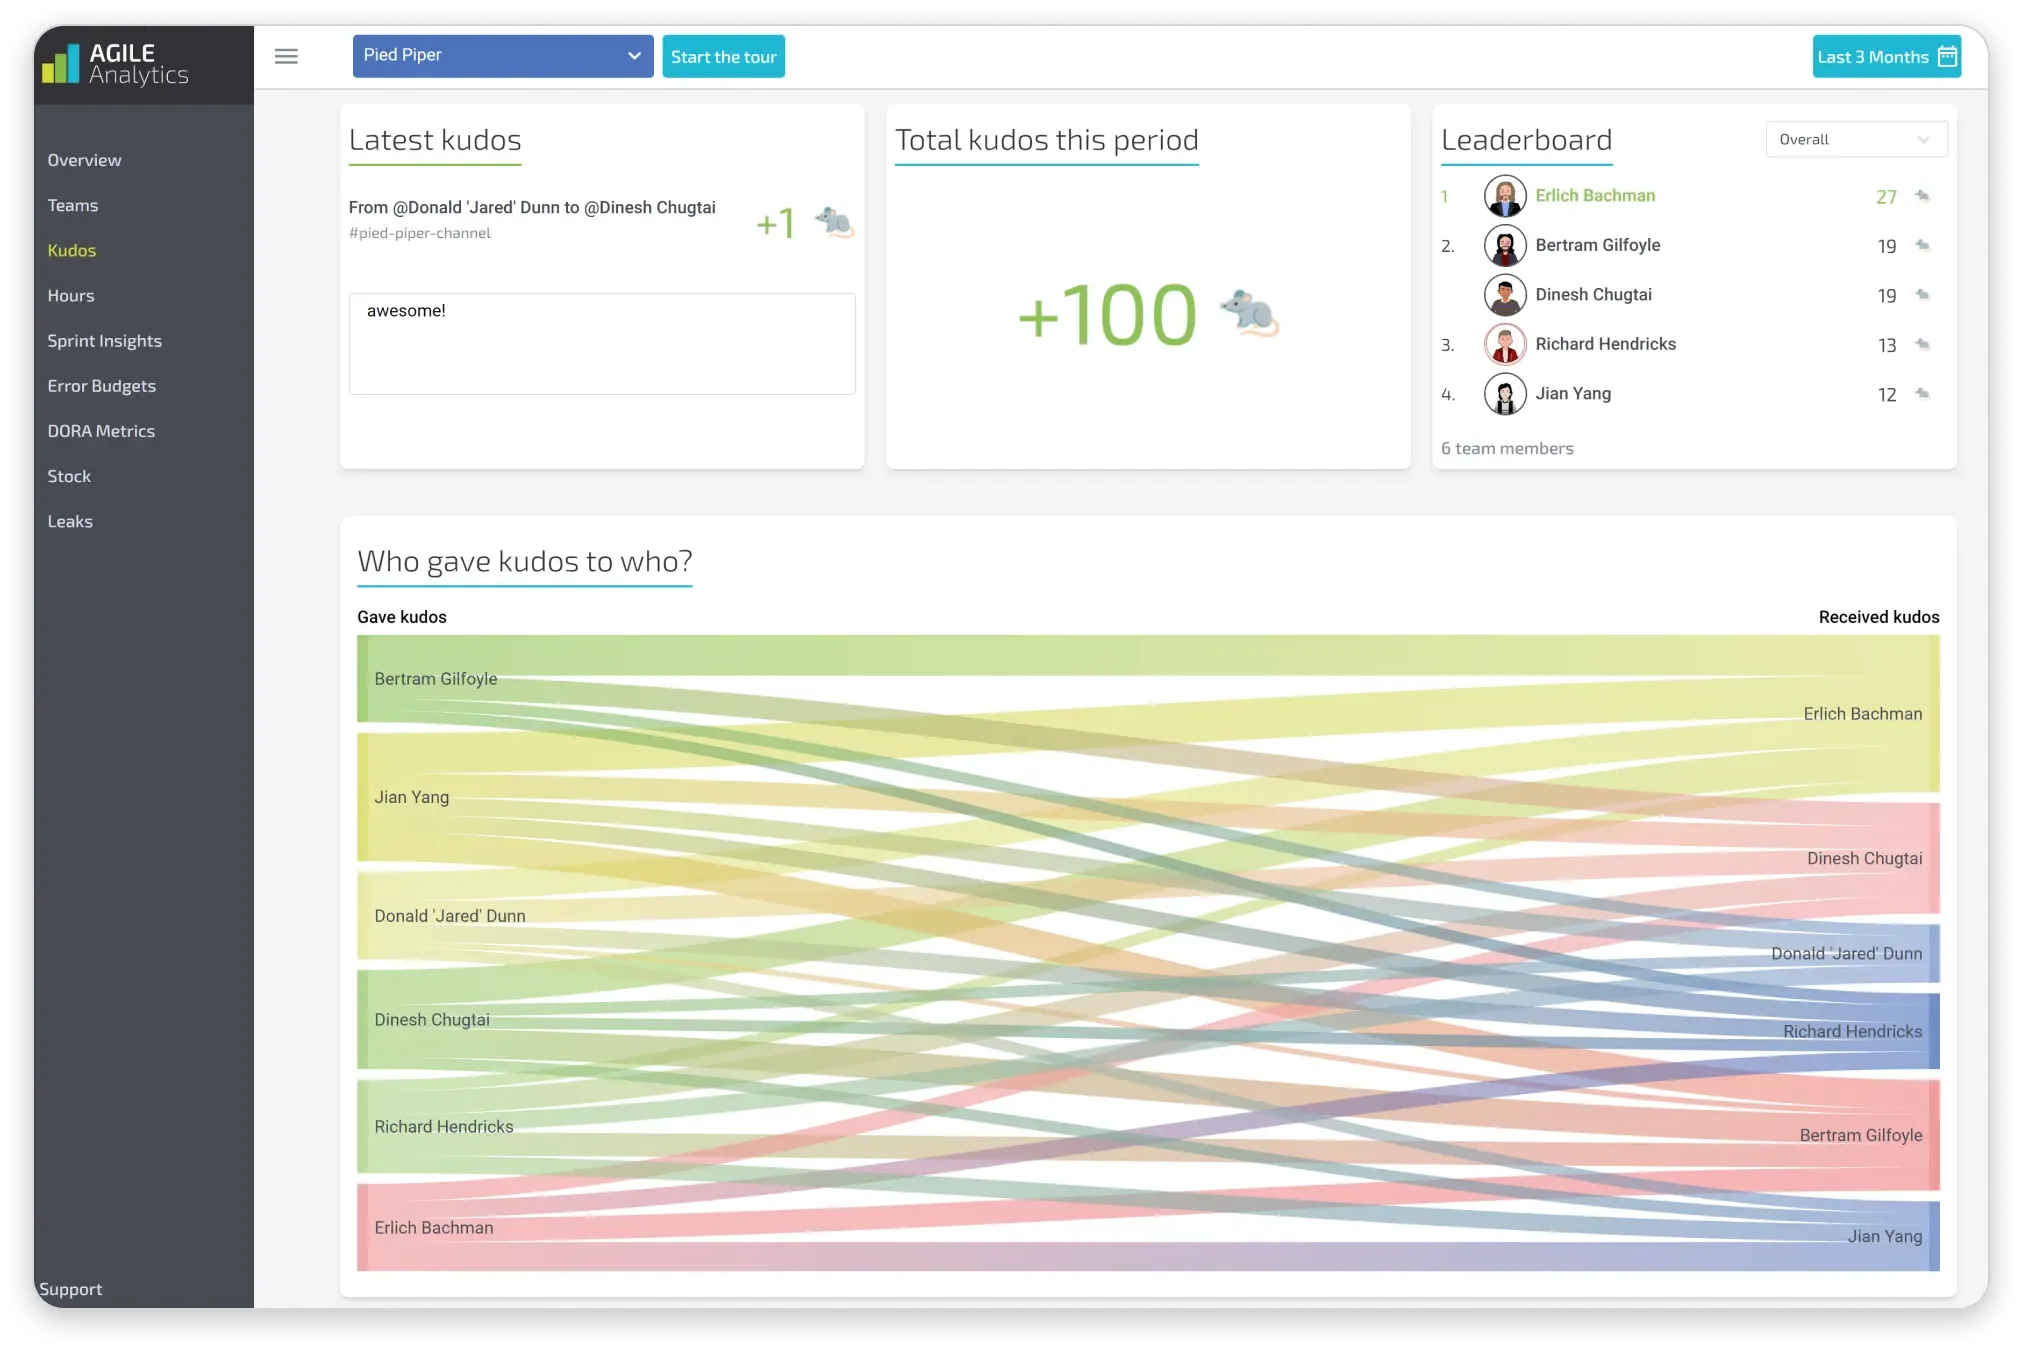
Good metrics turn chaos into something you can measure and manage. Our platform, Agile Analytics, shows this by connecting team feedback with operational data. This gives you complete visibility across distributed teams.
A Director of Engineering who led teams in five locations explains, "In order to measure something, you can track multiple imperfect metrics instead of finding one perfect one". Agile Analytics helps you spot bottlenecks and track performance. You can see how team happiness connects with system reliability.
Smart teams pick metrics that start useful discussions instead of tracking everything. Dashboards show trends across teams and services. You can turn these insights into actions that strike a chord with your teams without micromanaging. Clear communication becomes crucial in distributed teams where information gaps show up easily.
Cloud-native development isn't chaos. It creates freedom within structure through smart metrics and governance.
Essential Metrics for Governing Decentralised Engineering
Cloud-native teams can transform from seeming chaos into highly effective systems by measuring what matters. Our team at Agile Analytics discovered five metric categories that create the perfect balance between autonomy and governance.
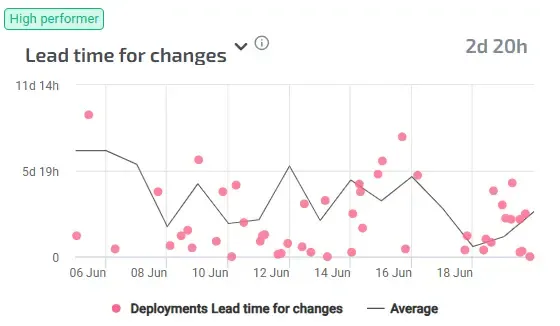
1. Lead time and cycle time
Lead time shows how long it takes from a client's request to delivery, while cycle time focuses on actual development time. These metrics give you clear visibility into your delivery pipeline:
-
Lead time shows how fast you respond to customer needs
-
Cycle time reveals your team's development efficiency
Teams with skilled developers can achieve lead times of 2-4 hours for changes. Other teams might need a week. You can spot bottlenecks and make your distributed teams more efficient by tracking these metrics.
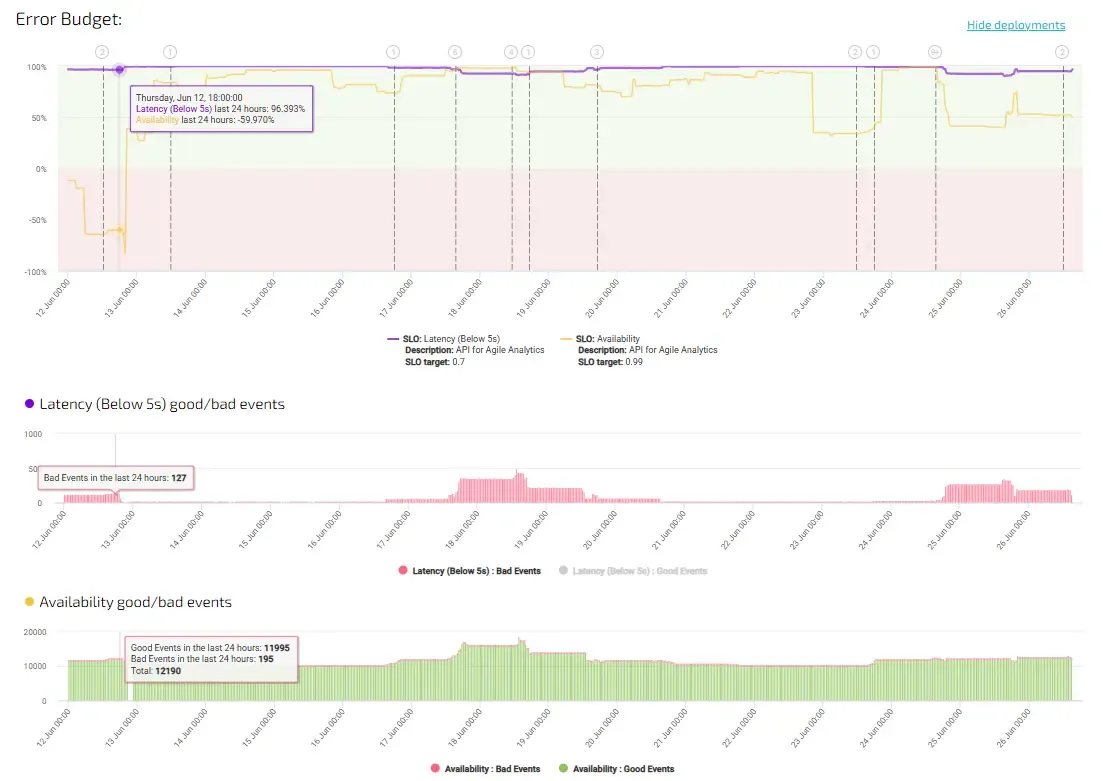
2. Error budgets and reliability scores
Error budgets help you measure acceptable "imperfection" before users become unhappy. Your error budget allows 1% downtime if your service's availability SLO is 99%. This creates a simple way to balance new features and stability:
-
Teams can deploy new features when the error budget remains
-
Reliability work becomes a priority when the budget runs low
This method stops teams from wasting resources chasing perfect reliability while keeping customers happy.
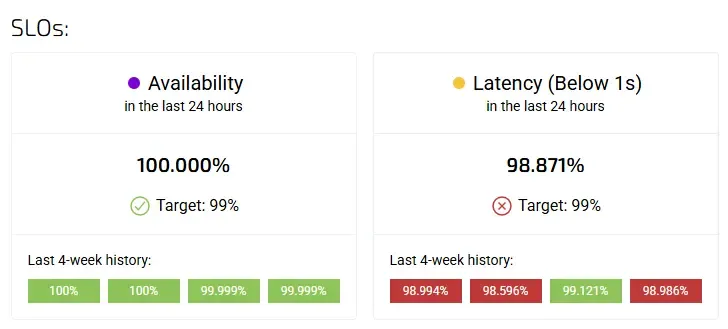
3. SLOs and SLA compliance
Service Level Objectives (SLOs) set targets for your Service Level Indicators (SLIs). SLAs define your contractual obligations. A good approach needs:
-
SLIs that measure performance aspects
-
SLOs that define targets (99.9% availability)
-
SLAs that formalise customer commitments
Success rate, latency, capacity, availability, and throughput make up common SLOs. Teams using metrics-driven governance can match engineering priorities with business goals through clear objectives.
4. Developer satisfaction and burnout indicators
Developer satisfaction directly links to productivity and code quality. Microsoft's research shows that developers with significant deep work time feel 50% more productive[3]. Key indicators also include:
-
Feedback mechanism quality
-
Work-life balance metrics
-
Team involvement levels
Agile Analytics links these satisfaction metrics with operational data to show important patterns that shape overall performance.
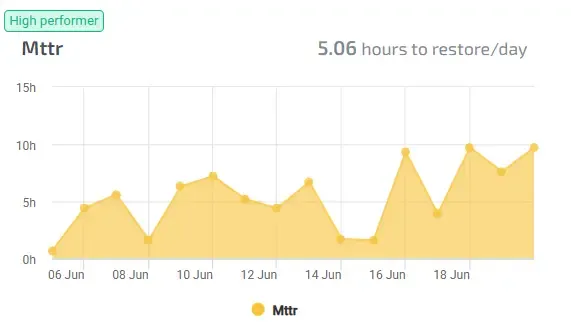
5. Change the failure rate and recovery time
Top teams keep change failure rates under 5%. Low-performing teams go above 30%. Recovery time (MTTR) shows how quickly your team bounces back from problems.
These metrics create a solid framework that turns distributed cloud-native teams from apparent chaos into well-governed, effective systems. Teams keep their speed and flexibility, which makes cloud-native architecture powerful.
How Agile Analytics Helps Connect the Dots
Modern cloud-native environments produce huge amounts of data. Raw numbers on a screen don't mean much without proper analysis. Statistics show more than 50% of Business Intelligence projects fail to deliver on time and meet end-goal requirements[4]. Advanced analytics plays a vital role in addressing this challenge.
Combining operational data with team feedback
Agile Analytics, our platform, connects operational metrics with human experience. Traditional monitoring tools only focus on system performance. Our platform merges technical data with team feedback to paint a complete picture. Technical teams work together daily. The platform weaves analytics into familiar workflows. Users can find answers quickly without depending on specialists or BI teams. Teams can break down information barriers and improve data quality while promoting teamwork.
Visualising trends across teams and services
Raw data transforms into practical insights through visualisation. Agile Analytics offers interactive dashboards that show a bird's-eye view of distributed environments. The platform supports time series graphs, bar charts, and heatmaps. These tools help teams understand performance metrics and spot patterns over time. Marketing teams can assess campaign performance in media channels of all types and adjust spending based on up-to-the-minute data analysis.
Highlighting meaningful correlations
Hidden relationships between seemingly unrelated metrics emerge through correlation analysis. Teams can understand how different elements interact, spot patterns, and predict future outcomes through context and correlation. Agile Analytics detects when applications receive massive traffic. This knowledge allows teams to allocate resources strategically. The platform also performs entity resolution by consolidating and linking records from multiple sources. Teams get a unified view of their distributed system.
Turning insights into targeted actions
Value comes from turning insights into action. Teams can shorten development cycles with clear, practical feedback through Agile Analytics. Performance metrics combined with network conditions and user behaviour help teams tackle bottlenecks proactively. Data visualisation tells a compelling story. Leaders can make informed decisions that boost system performance and team satisfaction.
Best Practices for Implementing Metrics-Driven Governance
Cloud-native environments need good governance that comes from careful planning rather than trying to control everything at once. A structured approach for decentralised teams helps maintain their independence. Here's how you can do this effectively.
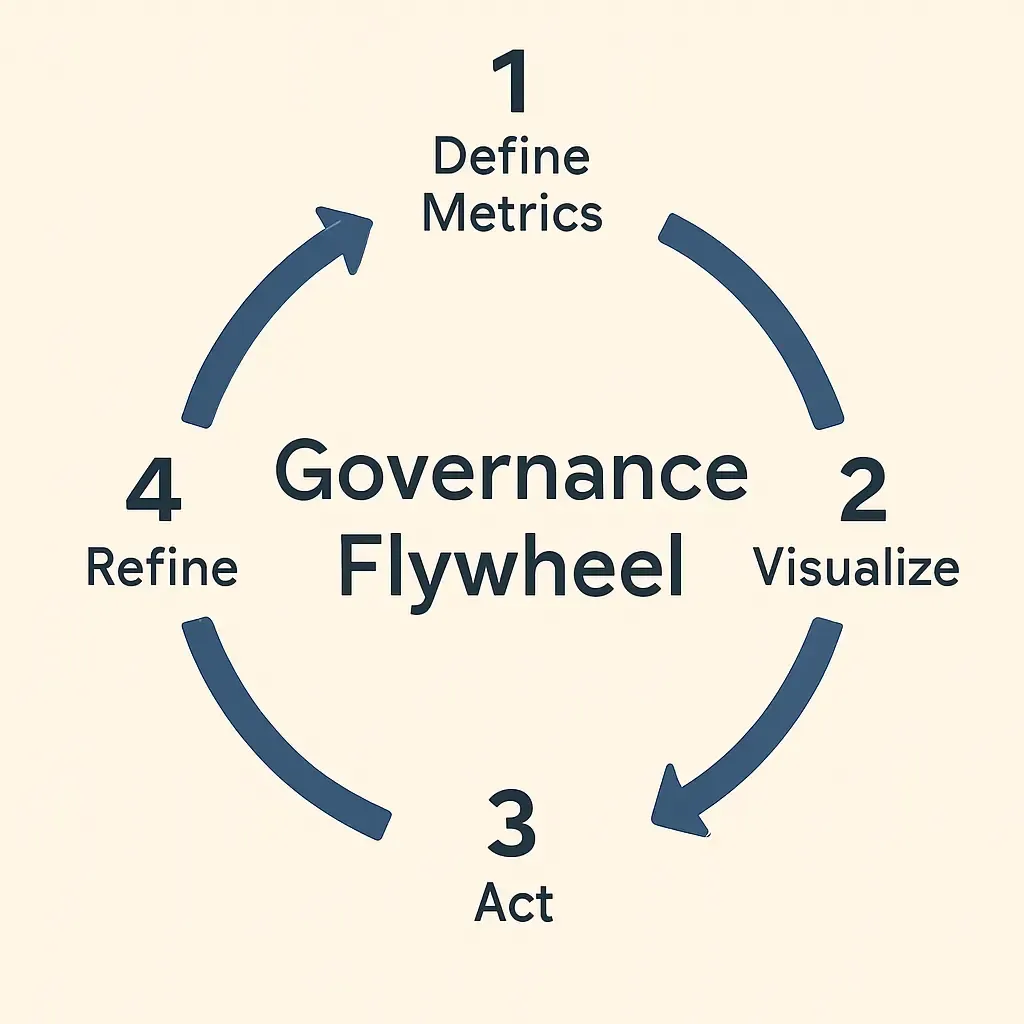
Start small and iterate
Evidence shows that metrics-based governance works best as a step-by-step experience. You should pick three to five capabilities to begin with[5]. Short iterations with specific goals make progress easier to track and measure. You can test these processes on a smaller scale and use team feedback to improve them continuously. The processes become ready to scale up when they need less feedback to work well.
Involve teams in metric selection
Good cloud governance needs experts and stakeholders from different teams to work together. Teams take more responsibility when they help choose their own metrics. The organisation should communicate its goals and metrics clearly. This helps everyone understand how their work fits into the bigger picture. Our Agile Analytics platform helps this process by connecting operational data with team feedback. Teams can see how their metrics affect overall results.
Automate data collection and reporting
Your performance metrics and logs should go into one central place. You need clear policies about how long to keep performance data. This helps balance storage needs with analysis requirements. Automation makes data collection consistent and reduces manual work. Agile Analytics handles this automation naturally. The platform gives you reliable data to find bottlenecks and improve productivity.
Use dashboards to drive conversations
Dashboards turn raw data into practical information by showing trends across teams and services. Leaders can quickly spot and fix risks using these visual tools. A well-designed dashboard shows problems over time and points out exactly when leaders need to step in. These visuals work best as conversation starters about ways to improve, not as tools for judgment.
Avoid micromanagement through transparency
Good communication between teams and management needs transparency. A culture of accountability grows when teams share metrics. This creates an environment where everyone knows how they contribute to common goals. Agile Analytics maintains this balance by turning insights into specific actions that appeal to teams without controlling their daily work. The result is structured freedom that delivers results.
Cloud-Native Structure Through Metrics-Driven Governance
Cloud-native architecture revolutionises how organisations operate. This transformation doesn't need to bring chaos. The evidence shows that decentralised engineering can thrive under structured freedom when the right metrics govern it.
The chaos people see comes from a lack of visibility rather than actual disorder. Teams create environments where autonomy flourishes without anarchy when they have clear boundaries, well-defined roles, and shared accountability. Good governance doesn't control everything - it builds frameworks that help teams make informed decisions.
Our Agile Analytics platform connects operational data with team feedback. This powerful combination spots bottlenecks, boosts productivity, and improves work satisfaction with applicable information. Organisations can track key metrics like lead time, error budgets, and SLOs while linking them to qualitative team feedback. The result transforms apparent chaos into measurable, manageable systems.
Metrics-driven governance gives many benefits to cloud-native organisations:
-
Transparent decision-making based on data rather than intuition
-
Balanced innovation and stability through error budgets
-
Better team satisfaction through meaningful autonomy
-
Reduced recovery times and failure rates
Your implementation should start small and iterate. Let teams help select metrics, automate data collection, and use dashboards to drive meaningful conversations instead of micromanaging performance.
Cloud-native environments become structured, predictable systems while keeping the agility that makes them powerful. These challenges become opportunities when you approach them with the right metrics and governance model.
Good governance creates conditions where distributed teams thrive. Agile Analytics bridges data and experience so your organisation can discover the full potential of cloud-native architecture without losing structure or stability.
Supercharge your Software Delivery!
Implement DevOps with Agile Analytics
Implement Site Reliability with Agile Analytics
Implement Service Level Objectives with Agile Analytics
Implement DORA Metrics with Agile Analytics