The agile software development life cycle: seven stages and what to measure at each

Published on 10 January 2025 by Zoia Baletska
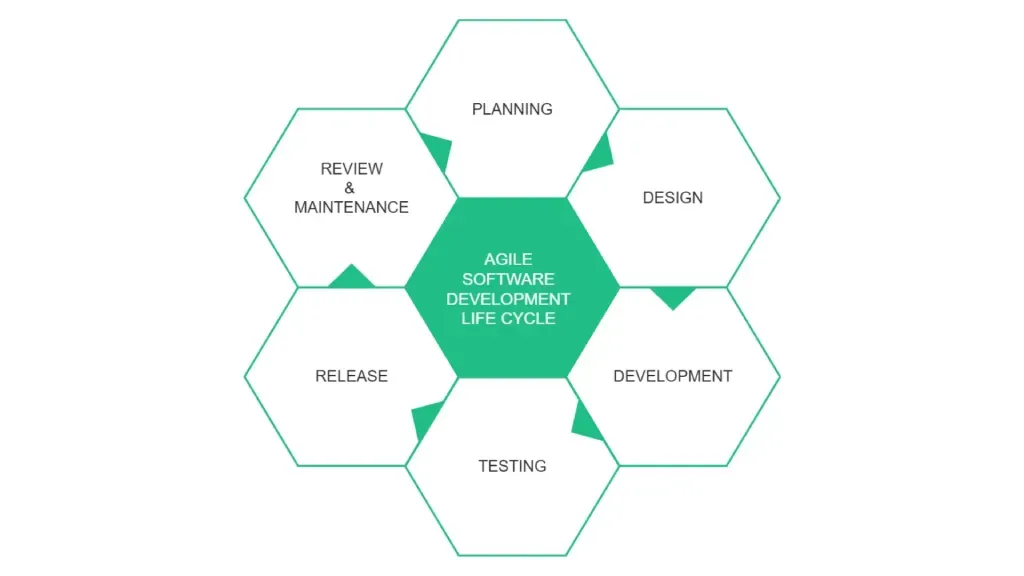
The agile software development life cycle (SDLC) is the sequence of stages a piece of software passes through: from an idea in the backlog to a change running in production and being learned from. In agile, that sequence repeats in short iterations rather than once per project. The waterfall SDLC walks the stages a single time over months. The agile SDLC walks all of them every sprint, or every day, for a small increment — one story or change, not a whole release.
Most explanations of the agile SDLC stop at naming the stages. That is the easy half. The harder question, and the one an engineering leader actually has to answer, is how do you know each stage is working? This article goes through the seven stages and, for each, the one or two measures that answer that question and the system that already holds the number.
What the agile SDLC is, and how it differs from the waterfall SDLC
Both life cycles contain the same work: someone decides what to build, designs it, builds it, tests it, releases it, runs it and reviews the result. The difference is the unit and the loop.
In a waterfall SDLC the unit is the project. Requirements are completed before design starts, design before development, and testing happens at the end, so the first time real users see anything is after every stage has finished once. Feedback arrives when it is most expensive to act on.
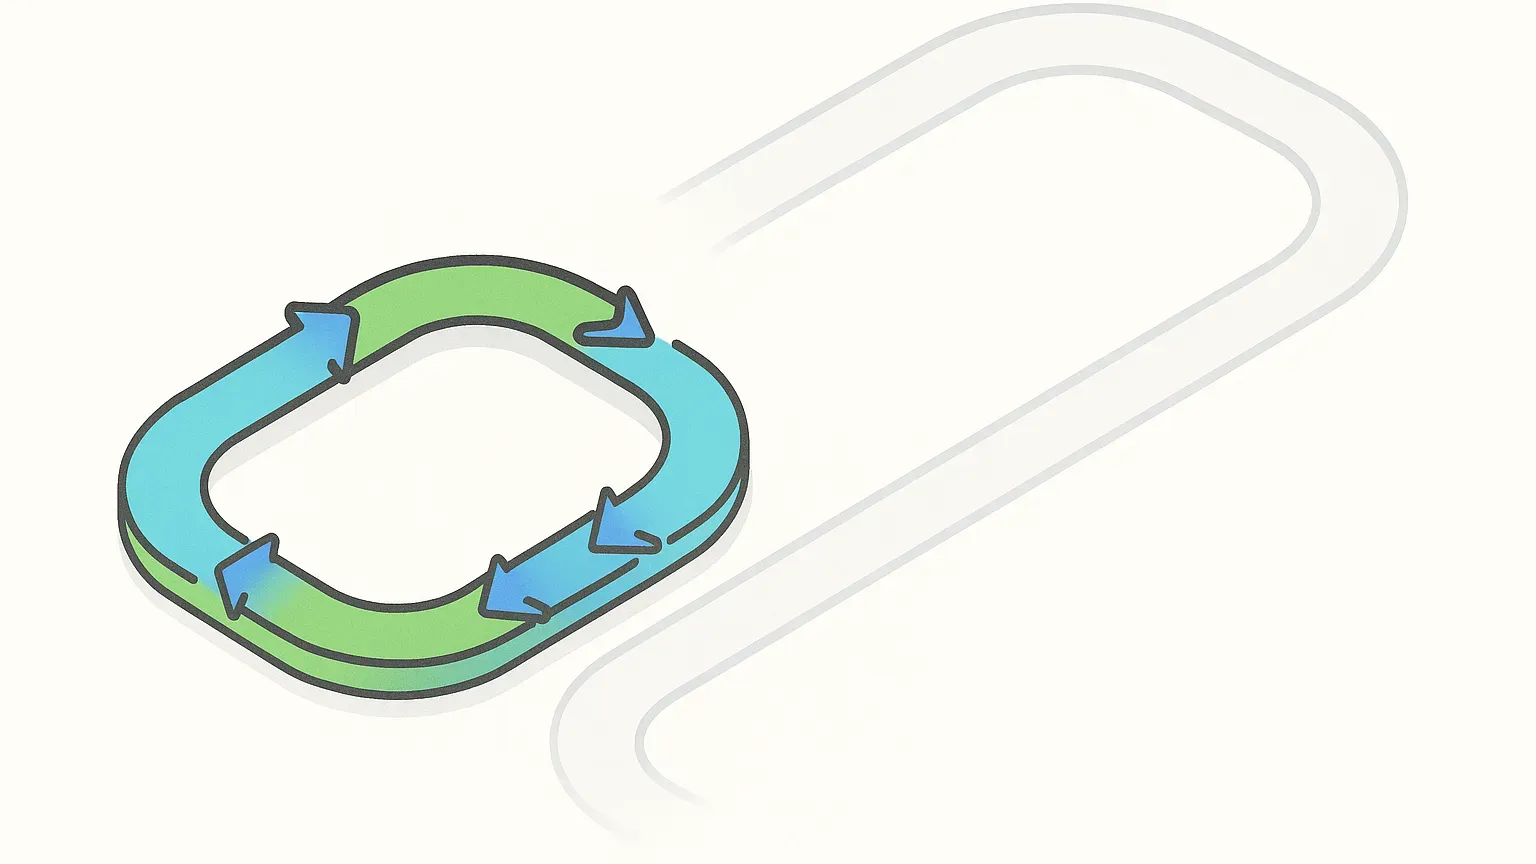
In an agile SDLC the unit is the increment — a user story, a change, a feature slice — and the whole cycle runs for each one. Planning, design, build, test and release happen within one iteration, and the review at the end feeds the next iteration's planning. The stages are the same; they are just short, overlapping and continuous. If you want the longer comparison, there is a separate piece on agile versus waterfall; the rest of this article assumes the agile shape.
One consequence matters for measurement: because the stages repeat constantly, each one produces a stream of events — tickets moving, pull requests opening, pipelines (the automated build-and-test runs) completing, deployments landing, incidents opening and closing. Those events are the raw material. You do not need a survey or a status report to measure an agile SDLC; you need to read the tools the team already uses.
The seven stages of the agile software development life cycle
Different frameworks draw the boundaries in different places — Scrum talks about sprints and events, Kanban about a continuous flow across a board, SAFe about program increments — but underneath, seven stages recur. For each one below: what happens, and what to measure.
1. Concept and planning
What happens. Ideas become backlog items. The product owner and the team refine them into user stories small enough to finish in one iteration, order them by value, and agree what the next iteration will take on. In Scrum this is backlog refinement and sprint planning; in Kanban it is the replenishment of the ready column.
What to measure. Backlog age — how long items have sat in the backlog before being started — and how much of the sprint's scope was actually planned versus pulled in mid-sprint. A backlog where the median item is a year old is not a plan, it is a graveyard, and refinement time spent on it is waste.
The second number to watch here is work in progress at the moment planning ends. If the team starts a sprint with as many items already in flight as it is about to pull, planning is describing intent, not capacity. Both numbers live in the issue tracker.
2. Design
What happens. Just enough design to start: an approach agreed at the whiteboard, an interface sketched, a decision recorded. Where the approach is genuinely uncertain, agile teams time-box the investigation as a spike whose output is knowledge rather than shippable code.
What to measure. Design is the stage least suited to a metric, and the one where forcing a number does the most harm. Two proxies are honest. The share of items that come back from development to design — reopened, re-scoped or split after work started — says whether the design was enough. And the time-box on spikes, kept: a spike that quietly becomes a three-week project is the design stage swallowing the development stage.
3. Development
What happens. Code is written, reviewed and merged, in small increments, behind a daily stand-up that exists to surface blockers early. The tools here are the repository and the pull request (a proposed code change awaiting review).
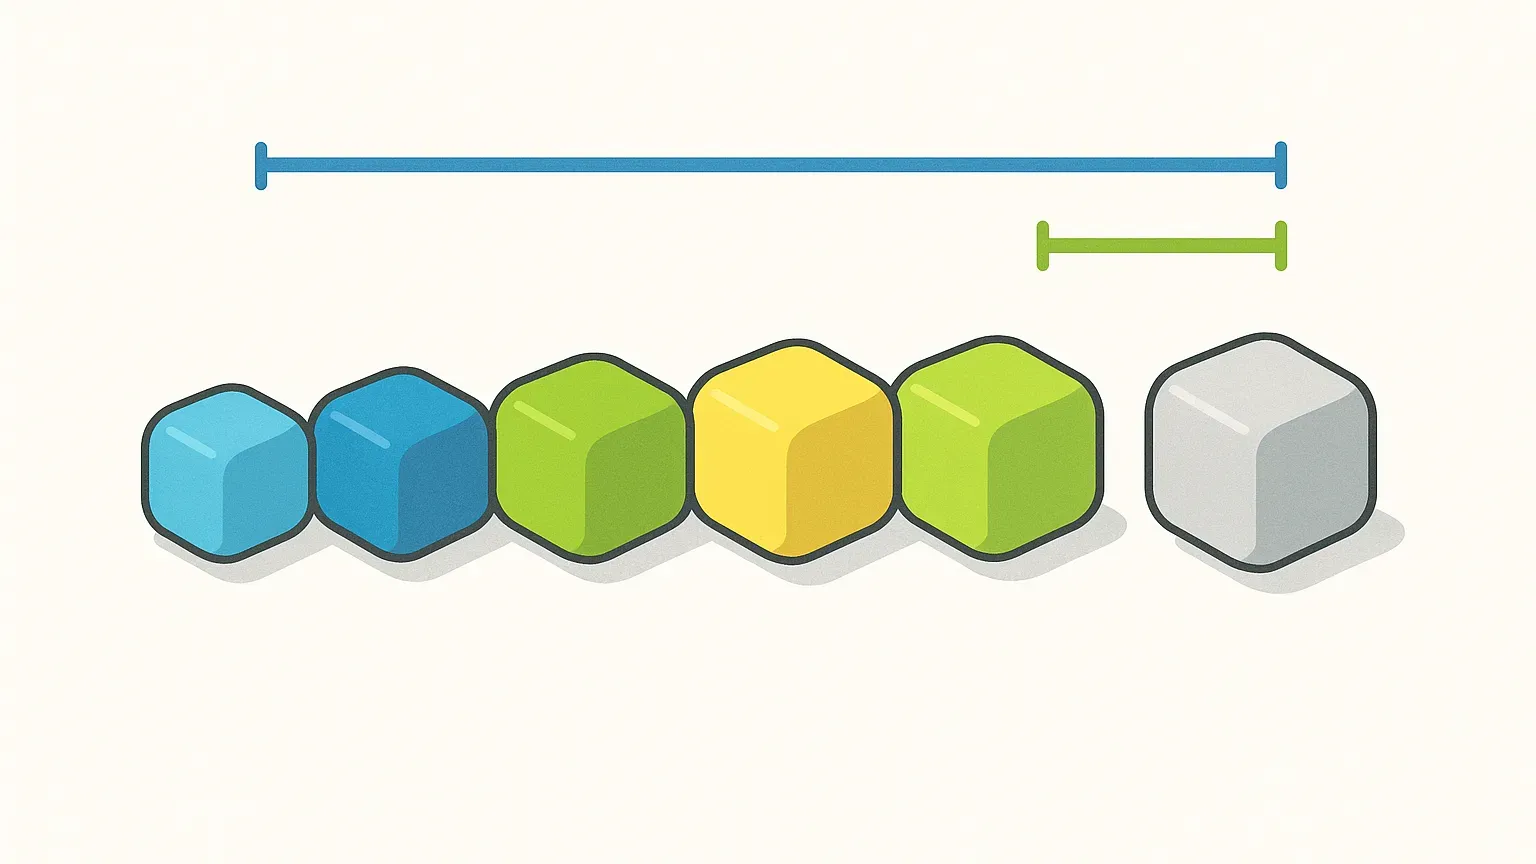
What to measure. Cycle time — from the first commit on a change to that change being merged — is the development stage's clock. Be precise about its boundaries, because cycle time and lead time are routinely confused.
Inside cycle time, the part to look at first is the review: how long a pull request waits before anyone looks at it, and how long it then sits in review. Waiting is usually the larger share, and it is invisible in a stand-up because nobody is doing anything wrong. Alongside it, pull request size: large changes wait longer, get shallower reviews, and fail more often downstream. All of this comes from Git.
4. Testing
What happens. In an agile SDLC testing is not a stage after development so much as a stage inside it. Unit tests are written with the code, integration and end-to-end tests run in the pipeline on every change, and the increment gets exploratory testing before it ships. The point is to find the defect while the person who wrote the change still has it in their head.
What to measure. Change failure rate — the share of changes that reach production and then need a hotfix, rollback or patch — is the testing stage's verdict, delivered late. It is one of the four DORA metrics, and it is the one that tells you whether the testing you did was the testing you needed. Earlier and cheaper signals are pipeline pass rate on the first run and the flakiness of the suite: a test that fails randomly trains people to re-run rather than read, and the escaped defects follow. These numbers come from CI.
5. Release
What happens. The increment goes to production — at the end of the sprint, or, in a continuous delivery setup, whenever a change passes the pipeline. Feature flags separate deploying from releasing, so code can reach production dark and be switched on later.
What to measure. Deployment frequency and lead time for changes, the other two DORA metrics. Frequency says how small your batches really are; a team that says it ships continuously but deploys on alternate Thursdays is batching, whatever the process document says.
Lead time for changes — from commit to running in production — spans the development, testing and release stages together. That is exactly why it is the one to watch: it goes up when any of the three is congested. Both are computed from Git plus the deployment record in CI/CD. If you want to see how they are derived and used in practice, that is what the DORA Metrics feature does.
6. Operate and monitor
What happens. The change runs. Someone is on call (carrying the pager for the service). Monitoring watches latency (response time), errors and saturation (how close to capacity the system runs), and users find the things the tests did not.
What to measure. Time to restore service — the fourth DORA metric — for when things break, and, for whether they are breaking too often, a small set of Service Level Objectives with an error budget behind each. An SLO states the reliability the service promises; the error budget is how much unreliability that promise leaves you to spend on change.
When the budget is healthy the team ships; when it is spent, reliability work moves to the front of the backlog — which closes the loop back to stage one without a meeting. If you have never written an SLO, start from worked SLO examples rather than from the theory. The data comes from monitoring and the incident tracker.
7. Review and retrospective
What happens. The sprint review shows the increment to stakeholders; the retrospective asks the team what to change about how it works. This is the stage that makes the cycle a cycle rather than a line.
What to measure. Nothing new — this is the stage where the numbers from the other six get read. A retrospective that opens with the sprint's cycle time trend, review wait, change failures and error budget burn is discussing what happened. One that opens with "what went well?" is discussing what people remember, and people remember the last three days.
For incidents specifically, a blameless post-mortem is the review stage applied to a single failure. The one measure worth adding here is whether the actions agreed in the last retrospective were actually done before the next one. If they were not, the retrospective is theatre, and the numbers will not move.
The life cycle is one flow, and lead time is its length
Seen stage by stage, the agile SDLC looks like seven separate things to optimise. Seen end to end it is one queue: an idea enters at planning and leaves at release, and the total time it spends in the system is the lead time the business feels. Most of that time is not spent being worked on. It is spent waiting — in the backlog for refinement, in the ready column for a developer, in review for a reviewer, in a staging environment for a release window.
This is what the flow metrics view adds to the stage view. The DORA metrics tell you how fast and how safely changes reach production. Flow metrics tell you where the time went: flow time, flow load (work in progress) and flow efficiency (the share of lead time that is active work rather than waiting).
A team with a long lead time and a short cycle time has a planning or release problem, not a development problem, and the retrospective should look there. The same idea underlies value stream metrics: measure the whole stream, not the busiest station. If you want a diagnostic walk-through, there is a separate piece on common bottlenecks in software development and how to identify them.
SDLC metrics at a glance
The measures above, by stage, with the system that already holds the data. None of them requires a survey, a time sheet or a new field on a ticket.
Planning — backlog age; work in progress at sprint start; planned versus unplanned scope. Source: issue tracker (Jira, Azure Boards, Linear).
Design — items returned from development to design; spike time-boxes kept. Source: issue tracker.
Development — cycle time; pull request wait time and review time; pull request size. Source: Git (GitHub, GitLab, Bitbucket).
Testing — change failure rate; pipeline first-run pass rate; test flakiness. Source: CI/CD.
Release — deployment frequency; lead time for changes. Source: Git plus the deployment record in CI/CD.
Operate — time to restore service; SLO attainment and error budget burn. Source: monitoring and the incident tracker.
Review — the six above, read as trends; retrospective actions completed. Source: the retrospective itself.
Four of these — deployment frequency, lead time for changes, change failure rate and time to restore — are the DORA metrics. They are the right place to start because they are defined the same way everywhere, which makes them comparable across teams and over time. The rest are the diagnostics you reach for when a DORA number moves and you want to know which stage moved it.
Mistakes teams make when measuring the life cycle
Treating velocity as productivity. Story points are a planning estimate in a unit the team defines for itself. Velocity going up means the team got better at estimating, changed the unit, or did more work — and you cannot tell which. It is a fine input to sprint planning and a poor output for anything else.
Measuring people instead of stages. Commits per developer, pull requests per developer, points per developer: every one of these is gameable within a week and corrosive within a month, and none of them locates a problem in the life cycle. Measure the flow of work through the stages; the people will show you where they are stuck if the numbers are not pointed at them. How that plays out in practice — and what to measure instead — is the subject of the developer experience literature.
Optimising one stage in isolation. A development stage with a two-hour cycle time feeding a release stage that ships fortnightly has not improved the life cycle; it has moved the queue. Always read a stage metric next to lead time for the whole.
Turning the measure into the target. The moment deployment frequency becomes a goal, someone will deploy an empty change. The DORA metrics are useful precisely because they are outcomes of a healthy process rather than things you can do directly; keep them as instruments and put the goals on the process.
Measuring from memory. If the retrospective's data is what people recall, the last incident dominates and the slow, steady decay in review wait time is never seen. Read the numbers from the systems, every iteration, so the trend exists before anyone has an opinion about it.
Where Agile Analytics fits
Everything in the table above already exists as events in Git, the issue tracker, CI/CD and monitoring. What is usually missing is the join: the same change followed from ticket to commit to pipeline to deployment to incident. With that join, a stage metric can be read against the lead time it contributes to. That join is what Agile Analytics computes — DORA Metrics, Error Budgets and Sprint Insights per team, from the tools you already run, refreshed every sprint, without anyone filling anything in. The stages are yours; the instrument reads them.
Frequently asked questions
What are the phases of the agile software development life cycle?
Seven, in most descriptions: concept and planning, design, development, testing, release, operate and monitor, and review and retrospective. Some models fold testing into development or operate into release, and some add a separate deployment phase between release and operate. The count matters less than the loop: in an agile SDLC every phase runs for each increment, and the review feeds the next planning.
What is the difference between the agile SDLC and the waterfall SDLC?
The stages are the same; the unit and the loop differ. Waterfall completes each stage once for the whole project, in order, so feedback from real use arrives at the end. Agile runs all the stages for each small increment and repeats, so feedback arrives within an iteration and changes the next one. That also changes what you can measure: waterfall yields a handful of milestone dates, agile yields a continuous stream of events.
Which SDLC metrics should a team start with?
The four DORA metrics: deployment frequency, lead time for changes, change failure rate and time to restore service. They are defined consistently, computed from systems rather than surveys, and cover the release and operate stages where problems become visible. Add cycle time and review wait time from the development stage next; they are where most lead time hides.
How does the DevOps life cycle relate to the agile SDLC?
They describe the same loop from different vantage points. The agile SDLC is written from the delivery team's side and puts weight on the planning, design and review stages. The DevOps life cycle is written from the operations side and puts weight on integration, deployment, operation and monitoring. A team practising both will find the DevOps stages sit inside the agile SDLC's development, testing, release and operate stages. That is why the DORA metrics — a DevOps research programme's output — measure the agile SDLC so well.
Is 'agile SDLC' the same as agile project management?
No. Agile project management is about how the work is organised — roles, ceremonies, prioritisation, the Scrum or Kanban framework the team follows. The agile SDLC is the path the software itself takes through that organisation. You can run the same life cycle under different project management frameworks, and the measures in this article apply to all of them.
Less guessing. More shipped software.
Measure faster — lead time, review wait and deployment frequency per team, every sprint
Guard quality — change failure rate, MTTR and Error Budgets
Prove the gain — feature work versus maintenance, from your own data
See it in 30 minutes — on your own data, not a slide deck