

When teams talk about improving software delivery, “The Four Key Metrics” often get name-dropped like a silver bullet. Originating from the DORA (DevOps Research and Assessment) reports, these metrics – Deployment Frequency, Lead Time for Changes, Change Failure Rate, and Mean Time to Recovery – have gained legendary status in Agile and DevOps circles. But understanding their real-world impact means going deeper than buzzwords.
These aren’t just numbers for dashboards. When used right, they become a mirror reflecting how well your engineering system operates. More importantly, they show where and how your teams can improve. Let’s unpack them one by one – and explore what it means to truly go beyond the buzz.
- Deployment Frequency: How often do you deploy to production?
This metric reveals how quickly your team ships value to users. Elite teams deploy multiple times a day. Lower-performing teams might ship once a month (or less).
But more frequent isn’t always better in isolation. If deployments are frequent but painful, error-prone, or gated by manual reviews, then you’ve got more frequent problems.
Healthy deployment frequency reflects:
-
Smooth CI/CD pipelines
-
Small batch sizes
-
Confidence in testing and rollback
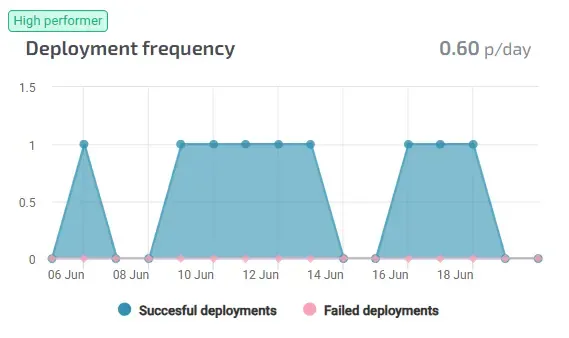
Real-world insight: Track deployment frequency per team or service. Averages lie. If one team ships daily and another quarterly, you’re hiding bottlenecks in the data.
- Lead Time for Changes: How fast does code go from commit to production?
This metric tracks agility. It's not about coding speed – it's about system efficiency. It captures the end-to-end time it takes for a committed code change to reach production.
Long lead times often reveal:
-
Bloated review processes
-
Queueing delays (e.g., waiting for QA or staging)
-
Environment provisioning issues
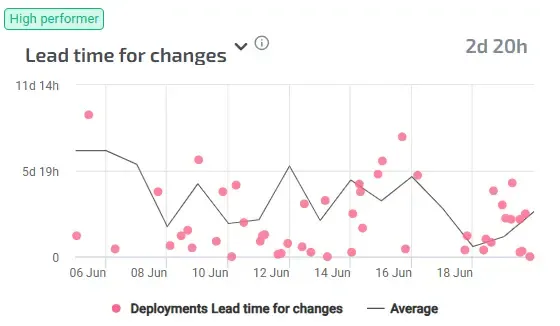
Why it matters: Lower lead time correlates strongly with adaptability. Teams with short lead times respond faster to customer needs, incidents, and business shifts.
- Change Failure Rate: What percentage of changes fail in production?
Here, “failure” means a code change that causes a bug, outage, or rollback. While speed is valuable, it must be paired with quality.
What you want to see: the ability to ship fast and safe. Elite teams often maintain failure rates below 15%, even with high deployment volumes.
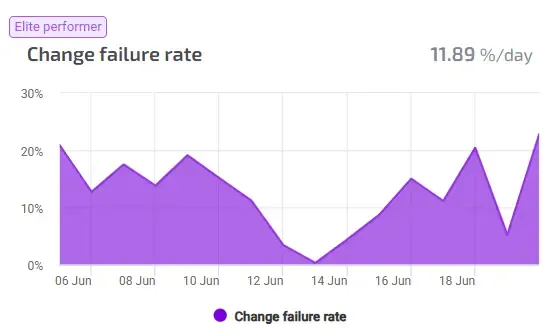
But beware: A 0% failure rate could mean you’re not shipping enough. Fear-based avoidance of change also kills innovation.
- Mean Time to Recovery (MTTR): How fast can you fix it when things break?
Failure is inevitable. What defines high-performing teams is how quickly they bounce back.
This metric shines a light on your:
-
Incident response workflows
-
Observability stack
-
On-call readiness and knowledge sharing
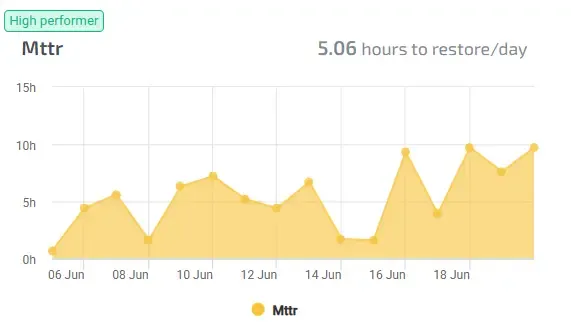
Beyond buzzwords: Fast recovery requires more than playbooks. It demands a culture that learns from failure, not one that punishes it.
Why These Four Matter (Together)
Taken together, these metrics give a full-spectrum view of engineering health. They balance speed, quality, and resilience. Tracking them over time lets you:
-
Spot delivery bottlenecks
-
Justify engineering investments
-
Benchmark progress against high-performing peers
-
Align technical teams with business outcomes
However, they only tell part of the story. Context matters. A team working on a regulated banking product might deploy weekly – and that’s perfectly okay. A low change failure rate in a risk-averse culture could signal underdelivery.
That’s why going beyond the buzzwords means pairing these metrics with human signals.
Powered by Agile Analytics
At Agile Analytics, we integrate 4KM metrics with real team sentiment and experience. Our platform doesn’t just show lead time – it shows how that metric correlates with developer satisfaction, perceived bottlenecks, and process friction.
By combining data and human feedback, we help engineering leaders:
-
Detect where slowdowns are felt the most
-
Prioritize improvements that matter to real teams
-
Move from vanity metrics to actionable insight
You don’t need more dashboards. You need a map and a compass. That’s what the 4 Key Metrics become when used with care.
From Metrics to Mastery
The Four Key Metrics are powerful, but they’re not magic. They're tools. Like any tool, their effectiveness depends on how you use them – and what conversations they spark.
Used well, they connect code to customer outcomes, engineering speed to business agility, and individual effort to organisational excellence. But only if you’re willing to go beyond the surface, and let the data guide continuous improvement.
If your teams are ready to move from dashboard-watching to decision-making, the journey starts with measuring what matters – and listening to what it means.
Supercharge your Software Delivery!
Implement DevOps with Agile Analytics
Implement Site Reliability with Agile Analytics
Implement Service Level Objectives with Agile Analytics
Implement DORA Metrics with Agile Analytics